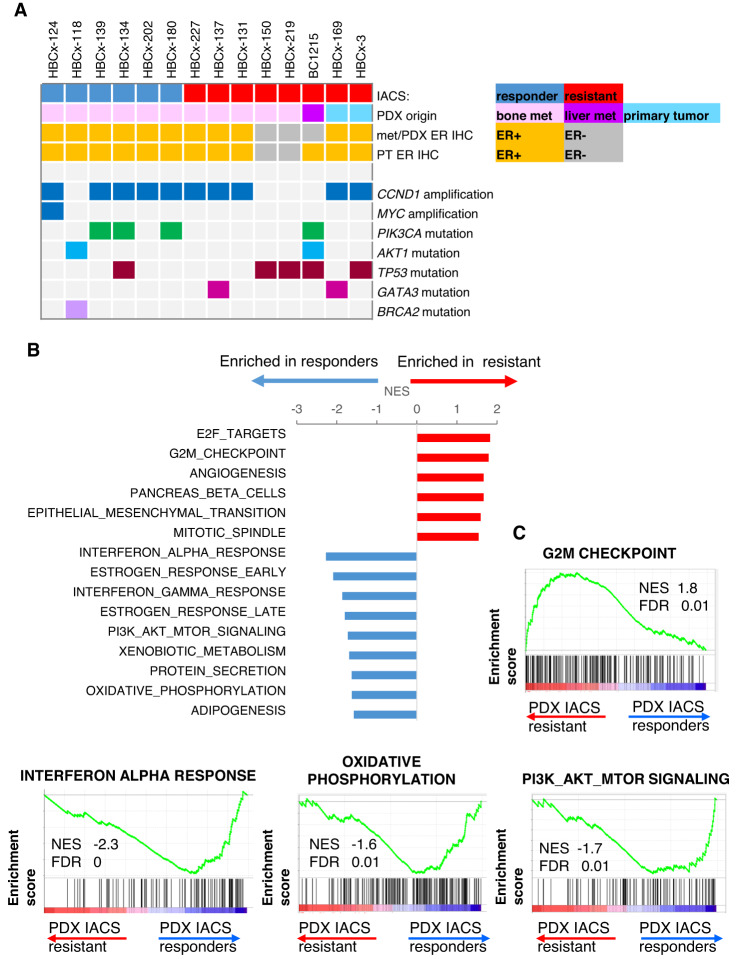
Fig. 4. Genomic analyses of PDX models.
A Oncoplot showing IACS response, the origin of PDX (bone metastasis, liver metastasis or breast primary tumour), the ER IHC status and the genomic alterations present in each PDX. B Top enriched hallmarks identified in the GSEA analysis of IACS responder and IACS resistant untreated ER + PDX models. Normalised enrichment scores (NES). C Enrichment plots of G2M checkpoint, interferon alpha response, OXPHOS and PI3K/AKT/mTOR hallmarks significantly associated with IACS response or resistance. NES normalised enrichment score, FDR false discovery rate adjusted p value.

