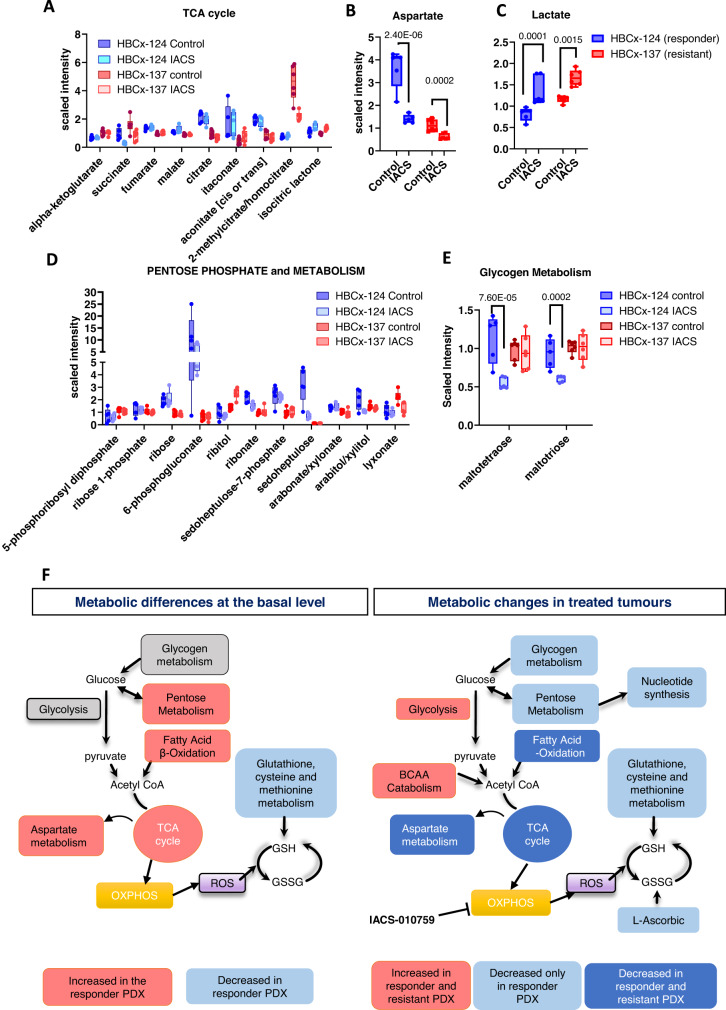
Fig. 6. Effect of OXPHOS inhibition on energy metabolism.
A Min/Max whisker plots showing the levels of TCA cycle metabolites in HBCx-124 (n = 5 mice/group) and HBCx-137 PDX (n = 6 mice/group) control and IACS-treated xenografts. (Mean ± SD). P and q values are shown in Supplementary Data 2. Level of aspartate (B) and lactate (C) in HBCx-124 (n = 5 mice/group) and HBCx-137 PDX (n = 6 mice/group) control and IACS-treated xenografts. (Mean ± SD). Min/Max whisker plots. (Two-way ANOVA, FDR corrected). D Metabolites levels of the pentose phosphate pathway metabolism (P and q values are shown in Supplementary Data 2.) in HBCx-124 (n = 5 mice/group) and HBCx-137 PDX (n = 6 mice/group) control and IACS-treated xenografts. (Mean ± SD). Min/Max whisker plots. E Glycogen metabolism in HBCx-124 (n = 5 mice/group) and HBCx-137 PDX (n = 6 mice/group) control and IACS-treated xenografts. (Mean ± SD). Min/Max whisker plots. (Two-way ANOVA, FDR corrected). F Overview of metabolic differences between HBCx-124 and HBCx-137 PDX and of metabolic changes in IACS-treated tumours. Source data are provided as a Source Data file. n number of mice.

