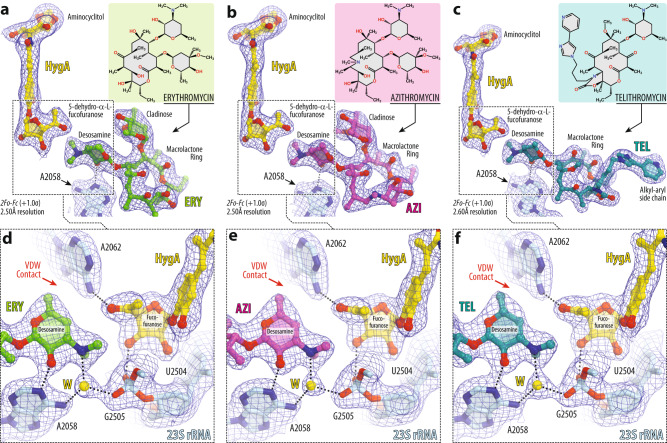
Fig. 3. Electron density maps of three macrolides bound to the T. thermophilus 70S ribosome together with hygromycin A.
2Fo-Fc electron difference Fourier maps of hygromycin A (HygA, yellow) and either erythromycin (a, ERY, green), or azithromycin (b, AZI, magenta), or telithromycin (c, TEL, teal). The refined models of antibiotics are displayed in their respective electron density maps after the refinement (blue mesh). The overall resolution of the corresponding structures and the contour levels of the depicted electron density maps are shown in the bottom left corner of each panel. Chemical structures of corresponding macrolides are shown as insets. Close-up views of high-resolution electron density maps of ribosome-bound HygA together with ERY (d), AZI (e), or TEL (f) interacting with the nucleotides of the 23S rRNA (light blue). Note that the dimethylamino group of all macrolides is rotated toward nucleotide A2058 and forms an H-bond with a water molecule (W, yellow) tightly coordinated by the exocyclic N6-amino group of A2058 and the phosphate of G2505. Nitrogens are colored blue; oxygens are red (except for the water). Also, note that the atoms of desosamine group of a macrolide form van der Waals contacts with the fucofuranose moiety of HygA and nucleobase A2062 (red arrows).

