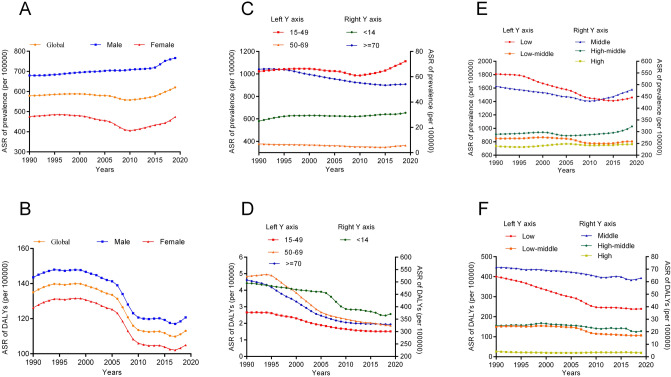
Figure 1.
Trend of ASR of syphilis from 1990 to 2019. (A) ASR of prevalence grouped by sex; (B) ASR of DALYs grouped by sex; (C) ASR of prevalence grouped by age, age 15–49 and 50–69 groups are depicted on the left axis, while other age groups are depicted on the right Y-axis; (D) ASR of DALYs grouped by age, age 15–49, 50–69, and ≥ 70 groups are depicted on the left axis, while age group < 14 years is depicted on the right Y-axis; (E) ASR of prevalence grouped by SDI levels, and low and low middle SDI groups are depicted on the left axis, while other SDI groups are depicted on the right Y-axis. (F) ASR of DALYs grouped by SDI levels, and low and low middle SDI groups are depicted on the left axis, while other SDI groups are depicted on the right Y-axis. DALYs disability-adjusted life years, ASR age-standardized rate, SDI sociodemographic index.

