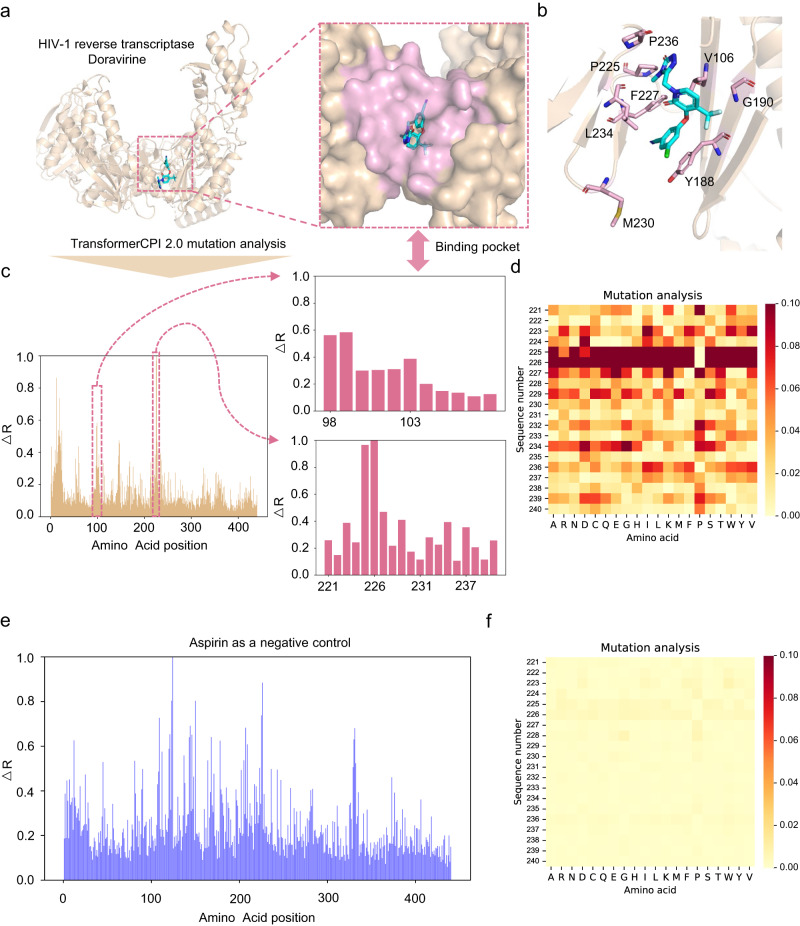
Fig. 2. Drug resistance mutation analysis.
a The cocrystal structure of HIV-1 reverse transcriptase and doravirine (PDB: 4NCG). The binding pocket of doravirine is highlighted in pink. b The binding mode of doravirine. The residues with drug-resistant mutations are colored pink. c Relative activity change score (ΔR) calculated by TransformerCPI2.0 at each amino acid position. The pink boxes mark the high ΔR regions, which are plotted in detail on the right. d The heatmap plots the activity change score of positions 221–240, where each position is mutated to each of the 20 amino acids (including itself). The darker color represents the higher activity change score caused by the mutation. e Relative activity change score (ΔR) calculated by TransformerCPI2.0 for each amino acid position. The pink boxes mark the high ΔR regions, which are plotted in detail on the right. f The heatmap plots the activity change score ΔS of positions 221–240, where each position is mutated to the 20 different amino acids (including itself). The darker color represents the higher activity change score caused by the mutation.

