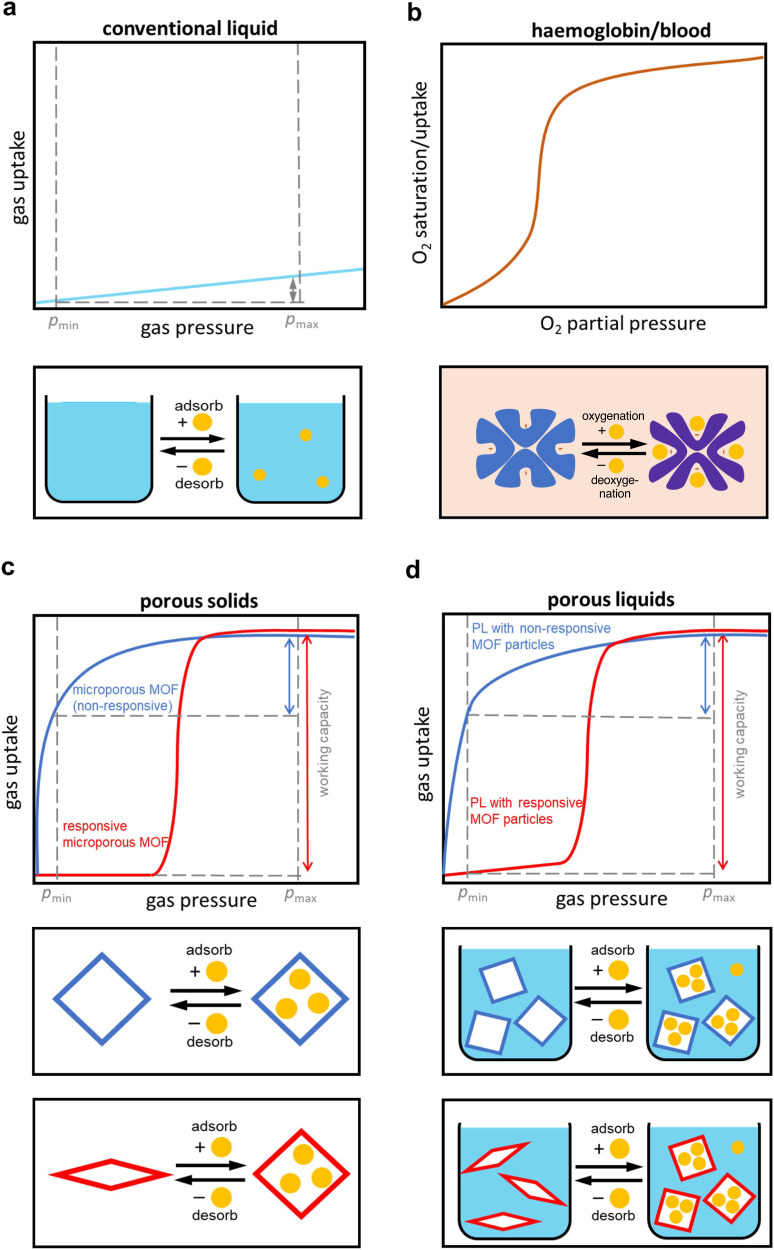
Fig. 1. Illustration of the gas sorption behaviour of liquids, porous solids, and porous liquids.
a Isothermal gas solubility curve of typical liquids. b Isothermal oxygen binding curve of haemoglobin. c Sorption isotherms of non-responsive (blue) and responsive (red) porous solids (i.e. microporous MOFs). d Isothermal gas uptake of PLs with non-responsive MOF particles (blue) and responsive MOF particles (red). Maximum adsorption pressure (pmax) and minimum desorption pressure (pmin) for a pressure swing are indicated by dashed vertical grey lines.

