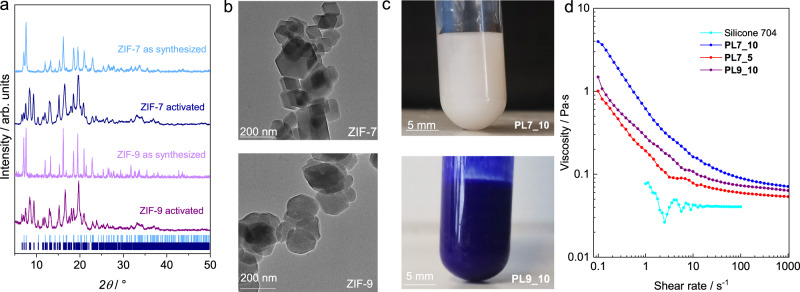
Fig. 3. Structural and rheological characterization of the PLs and their constituents.
a PXRD patterns of as synthesized and activated ZIF-7 and ZIF-9 nanocrystals. Tick marks represent the characteristic Bragg reflection positions of ZIF-7 np phase (dark blue)61 and lp phase (light blue)23. b TEM images of ZIF-7 and ZIF-9 nanocrystal aggregates. c Photographs of the dispersions of ZIF-7 and ZIF-9 nanocrystals in Silicone 704, PL7_10 and PL9_10. d Graph of the dynamic viscosity vs. shear rate for Silicone 704 and the corresponding ZIF-containing PLs at 25 °C and ambient pressure.

