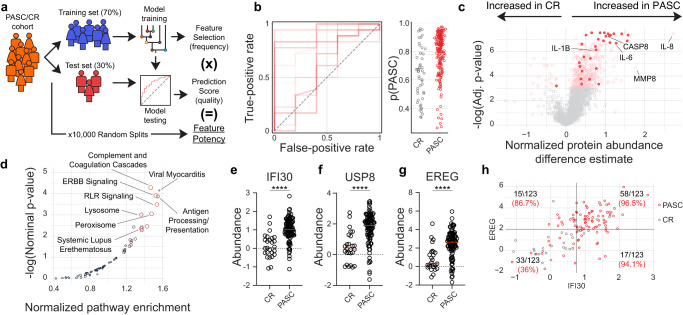
Fig. 2. RF modeling identifies PASC features.
a–g Blood plasma from 97 PASC patients and 26 CR controls was assessed for 2925 independent protein features. a Cartoon overview of random forest modeling approach and feature potency assessment. b Left—Receiver-operating characteristic (ROC) plot displaying ten models with randomized train/test splits classifying PASC and CR. Right—probabilistic classification plots for individual patients from the test sets derived from the ten models displayed in the ROC plot. c Feature-wise comparison between PASC and CR cohorts. Proteins of interest are labeled with the 30 features with highest feature potency highlighted. d KEGG pathway analysis of proteins ranked by feature potency in PASC discrimination modeling. e–g Normalized abundance of indicated proteins with means displayed (red). h Correlated but distinct information is provided by EREG and IFI30. Fraction of total samples and % purity indicated for each quadrant. e–g Two-tailed unpaired T test. *P < 0.05; **P < 0.01; ***P < 0.001, ****P < 0.0001. Source data are provided as a Source Data file.

