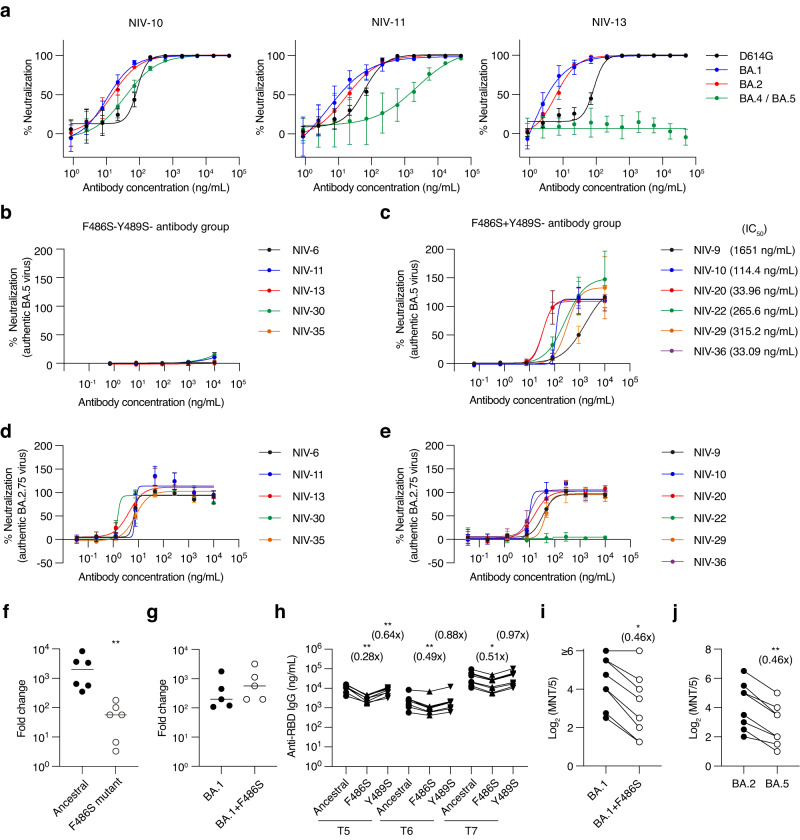
Fig. 4. Effect of F486S mutation on antibody binding and neutralization.
a Neutralization of NIV-10, NIV-11, and NIV-13 was examined with pseudovirus containing indicated spike protein. Data are presented as mean value ± SD (n = 4, technical replicate). b, c Neutralization of indicated antibodies and IC50 with authentic BA.5 virus are shown. Data are presented as mean value ± SD (n = 4, technical replicate). d, e Neutralization of indicated antibodies and IC50 with authentic BA.2.75 virus are shown. Data are presented as mean value ± SD (n = 3, technical replicate). f NIV-13 escape mutant clone and ancestral virus with passage without antibody were infected on VeroE6-TMPRSS2 cells at a multiplicity of infection of 0.01, and TCID50 was examined on days 0 and 3. Fold-change values are shown. Each symbol represents data from each virus clone (n = 6, biological replicate). Bars represent the mean value. g NIV-13 escape mutant was cloned from BA.1 passaged with NIV-13, and proliferation was examined as f. Each symbol represents data from each virus clone (n = 5, biological replicate). Bars represent the mean value. h Plasma IgG titer against ancestral and mutant RBDs is shown. Plasma samples were collected from the vaccine 1 month after the 2nd vaccination (T5), 5–6 months after the 2nd vaccination (T6), and 1 month after the 3rd vaccination (T7). Connected symbols represent data from each individual (n = 8, biological replicate). i Neutralization antibody titer of T7 plasma against BA.1 and BA.1 + F486S viruses are shown. Connected symbols represent data from each individual (n = 8, biological replicate). j Neutralization antibody titer of T7 plasma against BA.2 and BA.5 viruses are shown. Connected symbols represent data from each individual (n = 8, biological replicate). Data shown in (a–g) are representative of two independent experiments. *p < 0.05 (one-way ANOVA for h), p = 0.0156 (two-tailed Wilcoxon test for i); **p = 0.0022 (two-tailed Mann–Whitney test for f), p = 0.0078 (two-tailed Wilcoxon test for j), p < 0.01 (one-way ANOVA for h).

