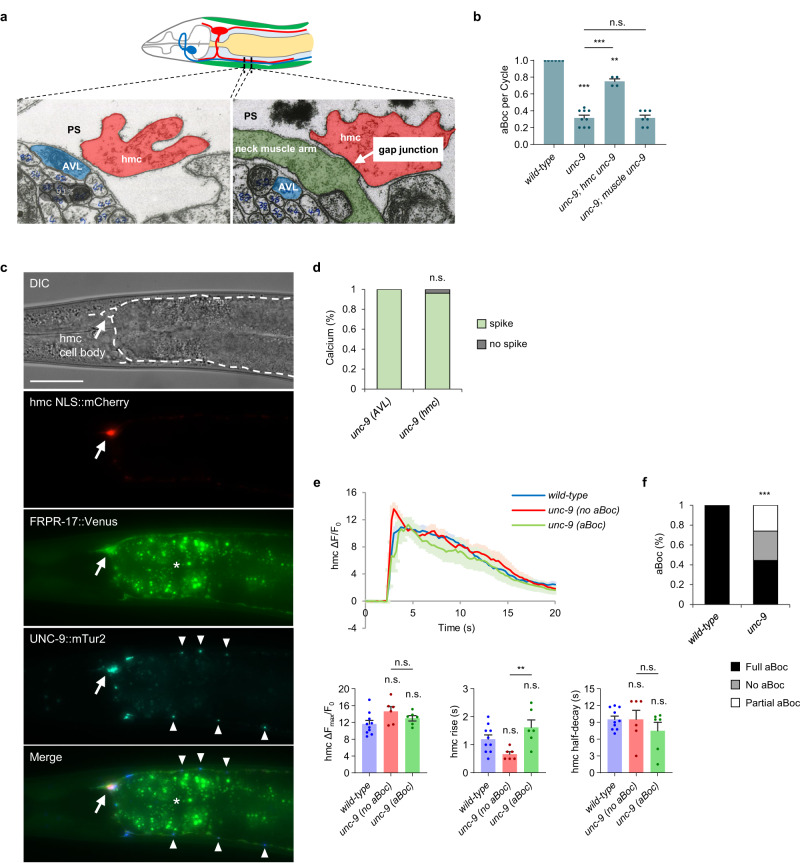
Fig. 4. Gap junctions composed of UNC-9/innexin are required for hmc signaling to neck muscles.
a Transmission electron micrograph images of cross sections on the ventral side of the neck showing the AVL and hmc processes, adapted from22. AVL and hmc are separated by the pseudocoelom (PS). A large gap junction appears as an electron dense area where the plasma membranes of the neck muscle arm and hmc contact each other. b Quantification of the number of aBocs per cycle in adult animals of the indicated genotypes. “hmc unc-9” and “muscle unc-9” denote expressing unc-9::mTur2 fusion proteins or unc-9 cDNA under the nmur-3(Δ) and myo-3 promoter, respectively. Data are presented as mean values ± SEM. n = 6, 9, 4, 7 independent animals. ***P < 0.001 and **P < 0.01 in one-way ANOVA with Bonferroni’s correction for multiple comparisons; n.s. not significant. c Representative images of the neck region of an animal co-expressing NLS::mCherry (arrow), FRPR-17::Venus (plasma membrane of hmc), and UNC-9::mTur2 (arrowheads) in hmc under the nmur-3(Δ) promoter. The dotted line in the top panel shows the position of hmc. The asterisk denotes autofluorescence in the intestine. Similar expression patterns were observed in all 16 animals examined. Scale bar, 40 μm. d Quantification of the number of calcium spikes observed in AVL and hmc during DMP in adult unc-9 mutants. For d and f, unc-9: 27 cycles in 9 animals. Two-sided Fisher’s exact test; n.s., not significant. e Average traces of calcium dynamics in hmc aligned to the calcium spike initiation time in the indicated mutants. The solid lines indicate average fold change in GCaMP intensity and the shades indicate SEM. Quantification of the average peak amplitude, rise time, and half-decay time. unc-9 (no aBoc) refers to cycles with calcium spike followed by no aBoc and unc-9 (aBoc) refers to cycles with calcium spike followed by aBoc. Data are presented as mean values ± SEM. n = 10, 6, 6 cycles from different animals. **P < 0.01 in one-way ANOVA with Bonferroni’s correction for multiple comparisons; n.s. not significant. f Quantification of the number aBocs observed per cycle in the indicated mutants in the time lapse calcium images. ***P < 0.001 in two-sided chi-square test.

