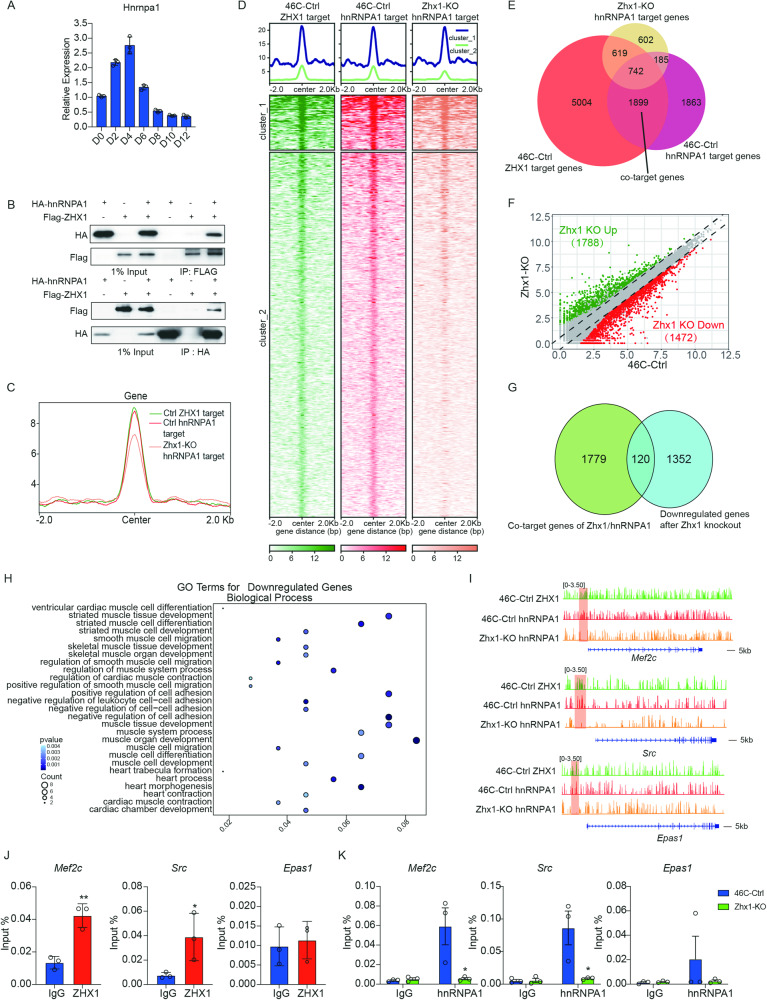
Fig. 4. Genome-wide analysis of Zhx1/hnRNPA1 on gene activation.
A The expression of Hnrnpa1 during the indicated days of cardiomyocyte differentiation. B Co-IP analysis for the interaction of ZHX1 and hnRNPA1. C The average profiles of ZHX1 and hnRNPA1 ChIP-seq at the genome-wide level in 46C-Ctrl cells and the hnRNPA1 ChIP-seq at the genome-wide level in Zhx1-KO cells. D Genome-wide heatmaps of the ZHX1 and hnRNPA1 enrichment of target genes in 46C-Ctrl cells, and the hnRNPA1 enrichment of target genes in Zhx1-KO cells. E Venn diagram shows the number of ZHX1/hnRNPA1 co-target genes in the CP stage. F RNA-seq scatterplot shows the upregulated (1788, green) and downregulated (1472, red) genes after Zhx1 knockout. G Cross-analysis for the co-target genes of ZHX1/hnRNPA1 and downregulated genes after Zhx1 knockout. H GO analysis for the co-target genes of ZHX1/hnRNPA1 which were downregulated after Zhx1 knockout. I Genome browser screenshots of ZHX1 and hnRNPA1 ChIP-seq on Mef2c, Src, and Epas1 genes in 46C-Ctrl cells, and hnRNPA1 ChIP-seq on Mef2c, Src, and Epas1 genes in Zhx1-KO cells. J ChIP analysis for the ZHX1 binding at the promoters of Mef2c, Src, and Epas1 genes. K ChIP analysis for the hnRNPA1 binding at the promoters of Mef2c, Src, and Epas1 genes after Zhx1 knockout. Data are presented as the mean ± SEM (n = 3). The statistical significance is performed according to Student’s t-tests (unpaired two-tailed). *p < 0.05, **p < 0.01, and ***p < 0.001 versus IgG or 46C-Ctrl.

