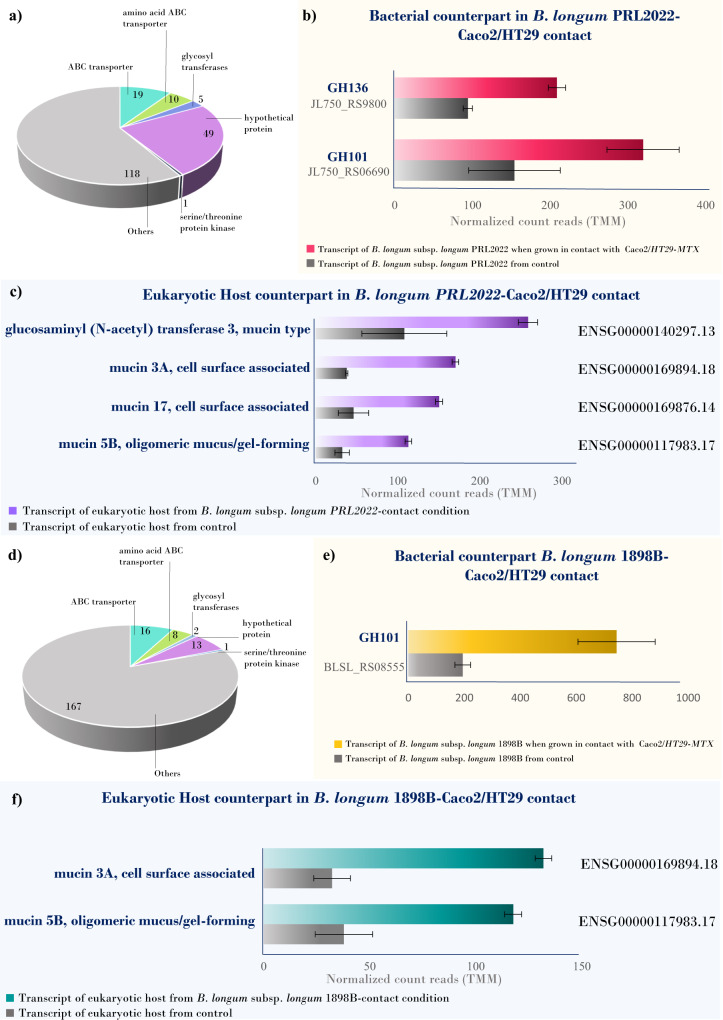
Fig. 4. Focus on differentially expressed bacterial mucin-degrading genes and host mucin-producing.
In panel (a), the chart graph highlights the number of different gene functional categories among the upregulated genes of B. longum subsp. longum PRL2022 when grown in contact with Caco2/HT29-MTX host cells. In panel (b), the horizontal bar plot shows the differentially expressed GH101 and GH136 mucin-degrading genes between B. longum subsp. longum PRL2022 grown in contact with Caco2/HT29-MTX human cells and control. In panel (c), the horizontal bar plot reports the mucin-producing genes found upregulated in the eukaryotic host transcriptome from B. longum PRL2022-exposed Caco2/HT29-MTX vs. control. Panel (d) depicts the number of different gene functional categories among the upregulated genes of B. longum subsp. longum 1898B when grown in contact with Caco2/HT29-MTX host cells. Panel (e) shows the differentially expressed GH101 mucin-degrading genes between B. longum subsp. longum 1898B grown in contact with Caco2/HT29-MTX human cells and control. In panel (f), the horizontal bar plot reports the mucin-producing genes found upregulated in the eukaryotic host transcriptome from B. longum 1898B-exposed Caco2/HT29-MTX vs. control. Error bars represent standard deviations from three independent replicates. After normalization of row counts, genewise exact tests were computed to assess the differential expression of each gene. Adjustment of p-values for multiple hypotheses was performed through the false discovery rate (FDR) procedure.

