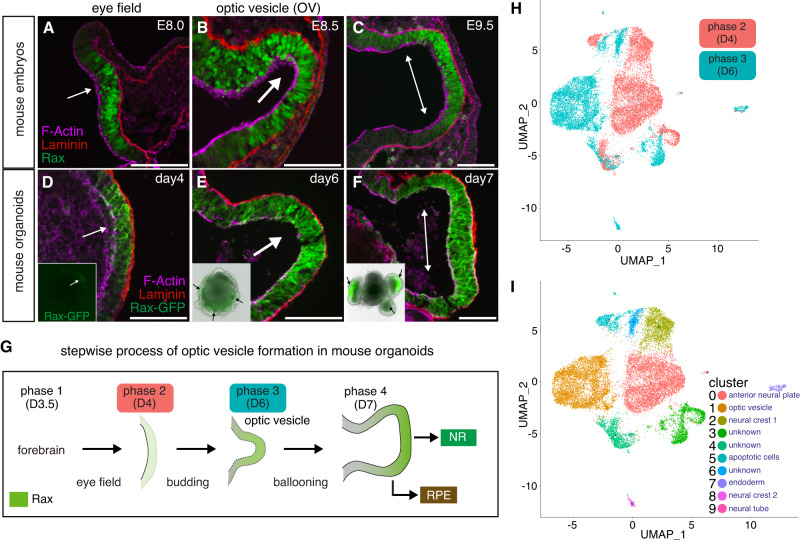
Fig. 1. Single cell transcriptomics of mouse eye organoids during optic vesicle evagination.
A–F Immunostaining of sections of optic vesicles from mouse embryos and eye organoids was performed using Laminin, Rax and GFP antibodies. DAPI and Phalloidin were used to label nuclei and F-actin, respectively. Insets show the merged images with bright fields and GFP channels at each embryonic and organoid stage. Black arrows in insets indicate evaginating OVs. Representative micrographs are shown as similar results were obtained from three independent experiments. G Schematic diagram showing the processes of OV evagination in eye organoids divided into four main phases. During phase 1 (day 3.5), forebrain identity is acquired; in phase 2 (day 4), weak and scattered Rax expression starts to be detected (eye field stage); in phase 3 (day 6), OV budding starts and Rax expression is increased; in phase 4 (day 7), through a ballooning process OVs fully evaginate and enlarge, and Rax expression its higher in the future neural retina territory (NR). Regions with lower levels of Rax expression will become the retina pigment epithelium (RPE). H Following single-cell RNA sequencing (scRNAseq) of the eye organoids, t-SNE plot analysis of phase 2 and phase 3 shows the obvious transcriptomic differences between these 2 stages. I t-SNE plot analysis shows each transcriptionally distinguishable cluster by unique colors. The bioinformatic analysis partitioned the cells of those two phases into 10 groups (clusters 0–9 are visualized using t-SNE). Each cell type is annotated based on a combination of known cell fate markers. Scale bars, 100 µm (A–F).

