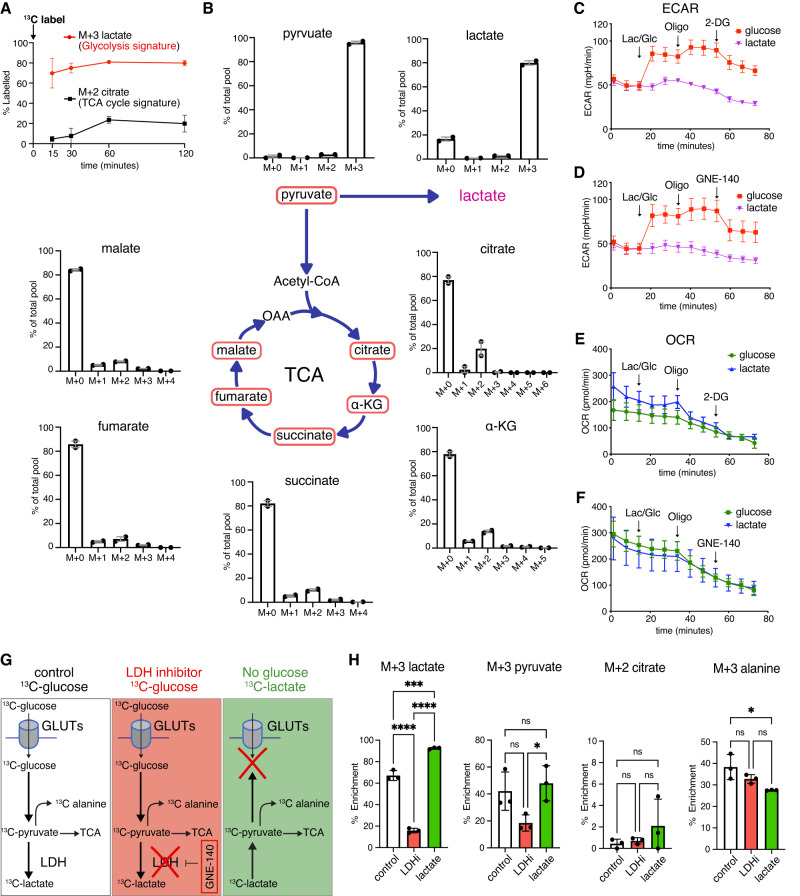
Fig. 4. 13C-isotope labeling reveals the profile of glycolytic intermediates during eye morphogenesis.
A, B The direct quantification of glucose consumption using 13C glucose time-course tracing was performed in cultured eye organoids and measured by LC-MS/MS analysis. Amongst all detected glycolytic intermediates, the main 13C glucose-derivatives were pyruvate and lactate, while the levels of citrate, one of the signature metabolites of the TCA cycle were extremely low. The M + 0, M + 1, M + 2 and M + 3 metabolites were measured as % of the total pool to distinguish unlabeled and labeled metabolites. The labeled lactate during glycolysis saturated up to 80%. In the TCA cycle, citrate shows that only about 20% of the succinate pool was 13C labeled. C–F To evaluate glycolysis and mitochondrial respiration, seahorse analysis was performed to measure eye organoids-derived extracellular acidification rate (ECAR) and oxygen consumption rate (OCR). Injecting glucose (Glu) elevated ECAR whereas lactate (Lac) did not. Oligomycin (Oligo), an inhibitor of ATP synthase necessary for oxidative phosphorylation further increased ECAR levels. Subsequent addition of either 2-DG or GNE-140 depleted the ECAR to the basal level. G, H 13C-glucose labeling under three conditions: 13C-glucose = control (white scheme), 13C-glucose + LDHi = LHDi (red scheme), 13C-lactate in glucose free media mimicking the lack of glucose uptake = lactate (green scheme). Treatment with LDHi (which prevents OV morphogenesis) significantly reduced 13C-labeled lactate; however, it did not change the levels of pyruvate, citrate and alanine. 13C-lactate was not dramatically metabolized into TCA cycle specific metabolites as seen in M + 2 citrate. One-way ANOVA followed by Tukey’s post-hoc test was performed (H). ****p < 0.0001, ***p < 0.001, *p < 0.05, n.s. not significant (H). Data are presented as mean values +/−SEM (H). Source data are provided as a Source Data file. n = 3 biologically independent experiments were performed.

