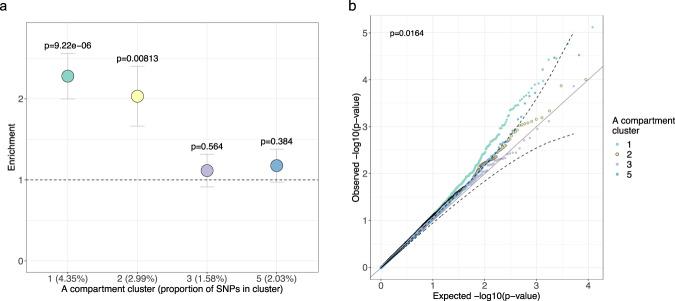
Fig. 4. The A compartment cluster 1 contributes significantly to the heritability of CRP and is enriched for genotype-by-BMI interaction effects on CRP in the UK Biobank.
a Dotplot shows the enrichment of heritability for CRP in the different A compartment clusters relative to the null hypothesis of the uniform contribution from all SNPs. Partitioned LD-score regression (LDSC)26,27 was performed using the C-reactive protein (CRP) summary statistics from the UK Biobank round 2 GWAS results from 343,524 individuals, hosted at the Neale Lab website (http://www.nealelab.is/uk-biobank/). Error bars represent the heritability enrichment standard error (SE) and the data were presented as the enrichment of heritability for CRP calculated from LDSC ± the enrichment SE. The SE for the proportion of h2 and enrichment were calculated from the block jackknife resampling using the LDSC method. The p value is calculated using the proportion of heritability and the proportion of heritability SE from the block jackknife resampling, and computing a z-score (two-sided test for significance of enrichment). The x-axis tick marks list the A compartment cluster with the proportion of SNPs in that cluster in parentheses. b Q-Q plots for the uniform distribution of the p values for the genotype-by-BMI interaction effects on CRP in the UKB, stratified by which of the A compartment clusters the SNP lands in. Confidence intervals (dashed lines) were calculated for the A compartment cluster 3. The overall p value corresponds to the Kruskal–Wallis test for differences among all cluster p value distributions. Cluster 1 has a higher accumulation of low p value SNPs than cluster 5 in the post hoc Dunn test (p = 0.041 after correcting for multiple testing using the Holm procedure). CRP indicates C-reactive protein. Source data are provided as a Source Data file.

