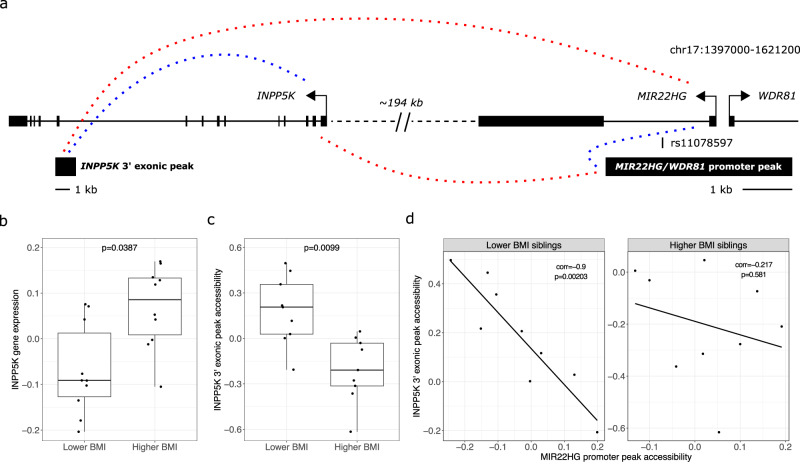
Fig. 5. An example of a disruption in ATAC peak co-accessibility in the higher BMI MZ siblings and how it is linked to the twins’ differential expression of INPP5K.
a Schematic of the genomic locus containing the MIR22HG promoter ATAC-seq peak that harbors a GWAS SNP rs11078597 for CRP, TGs, and ALT. Dashed lines represent significant correlations between peak accessibility and gene expression. Red dashed lines indicate positive correlations and blue dashed lines indicate negative correlations. Boxplots show the b differential expression of INPP5K (n = 10 pairs of MZ twins) and c differential accessibility of an ATAC-seq peak toward the 3’ end of the INPP5K gene (n = 9 pairs of MZ twins) between the lower and higher BMI MZ siblings’ preadipocyte data. P values correspond to the two-sided paired t-test. The boxplot center represents the median expression of the indicated gene set in the indicated compartment type, the upper and lower bounds of the box represent the 75th and 25th percentile, respectively, and the upper and lower whiskers represent the highest (non-outlier) and lowest (non-outlier) values, respectively. d The Spearman’s rank correlation between the MIR22HG promoter peak and the INPP5K exonic peak is shown for the lower (left, n = 9 lower BMI MZ siblings) and higher (right, n = 9 higher BMI MZ siblings) BMI MZ siblings separately. The significance of the difference in correlation was assessed using Fisher’s z-transformation (p = 0.027). Source data are provided as a Source Data file.

