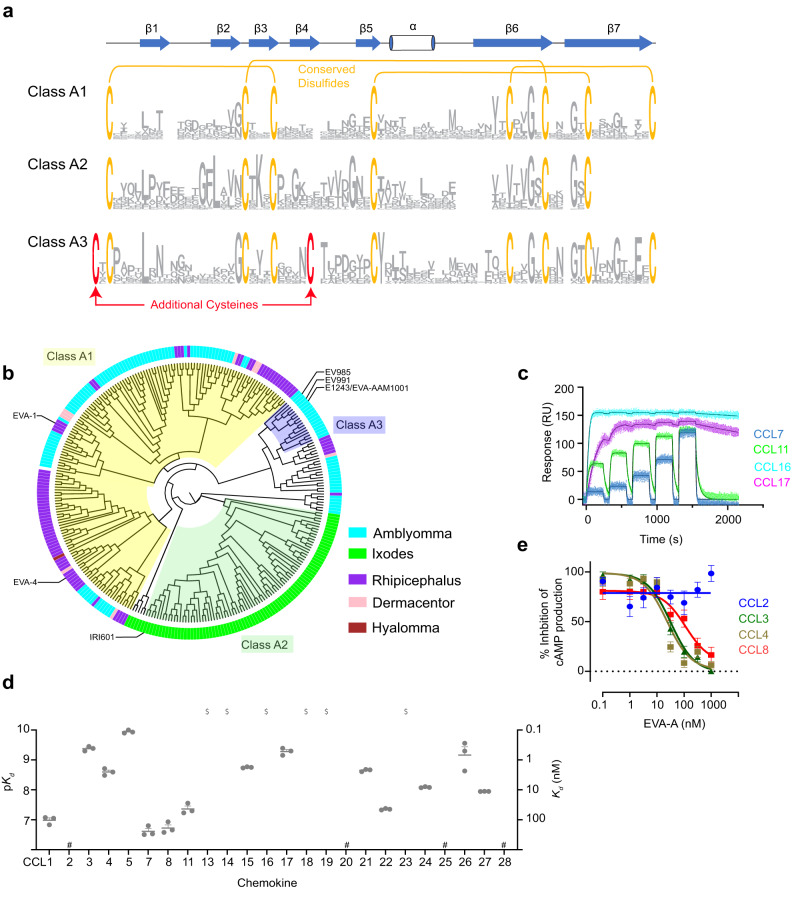
Fig. 1. Discovery and characterisation of class A3 evasins.
a Sequence logo based on alignments of class A evasins (class A1: n = 149, class A2: n = 65 and class A3: n = 17). Conserved cysteine and disulfide bond connectivity are indicated for class A1 evasins (orange). The additional cysteine and disulfide bond of class A3 are indicated in red. The secondary structure of EVA-P974 (class A1) is shown above the alignment. b A midpoint-rooted, neighbour-joining tree represented as a cladogram, based on MUSCLE alignments of the class A evasins. Background colours show subclasses; A1 (light yellow), A2 (green) and A3 (purple). The genus of each node is indicated by coloured segments in the outer ring and shown in the legend. c Representative binding sensorgrams of human chemokines (5 injections at consecutive concentrations of 31.25, 62.5, 125, 250 and 500 nM) measured by SPR using single-cycle kinetics. d Binding affinities (Kd) of EVA-A for CC chemokines, measured by SPR. Data are presented as mean ± SEM from three independent experiments. $, Kd < 0.1 nM; #, no measurable binding at 500 nM chemokine concentration. e Concentration response curves showing the inhibition of chemokines CCL3, CCL4 and CCL8, but not CCL2, by EVA-A. FlpInCHO cells stably expressing CCR5 (for CCL3, CCL4 and CCL8) or CCR2 (for CCL2) and transfected with the cAMP biosensor CAMYEL, were treated with coelenterazine h (5 μM, 10 min), followed by forskolin (10 μM, 10 min) to induce cAMP production, followed by CCL3 (60 nM), CCL4 (80 nM), CCL8 (100 nM) or CCL2 (100 nM), either alone or pre-incubated with the indicated concentrations of EVA-A. cAMP was detected 10 min after chemokine addition. Data are represented as a percentage of the inhibition of cAMP production observed upon chemokine treatment in the absence of EVA-A, and presented as mean ± SEM from three or four independent experiments.

