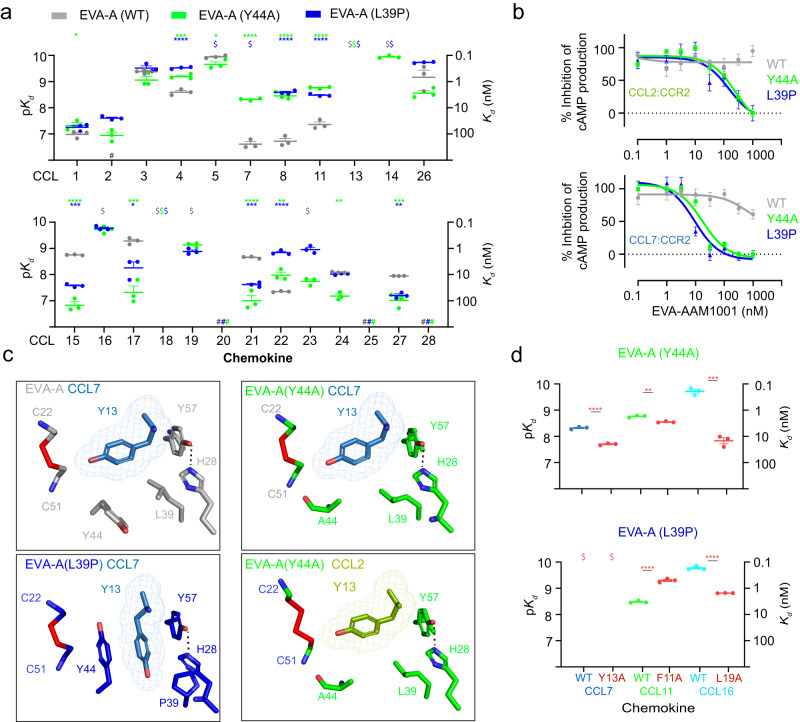
Fig. 4. Engineering of the EVA-A hydrophobic pocket.
a CC chemokine affinities (Kd) of EVA-A (grey), EVA-A(Y44A) (green) and EVA-A(L39P) (blue). Upper panel, chemokines with aromatic CC + 1 residues; lower panel, chemokines with aliphatic CC + 1 residues. Data are presented as mean ± SEM from three independent experiments. $, Kd < 0.1 nM; #, no measurable binding at 500 nM chemokine concentration; *p < 0.05, ****p < 0.0001, versus wild type EVA-A (one-way ANOVA with Šídák correction for multiple comparisons; or a two-tailed t test if only a single comparison was possible). b Concentration-response curves showing the inhibition of CCL2 (100 nM) (top Panel) and CCL7 (100 nM) (bottom panel) by EVA-A, EVA-A(Y44A) and EVA-A(L39P). FlpInCHO cells stably expressing CCR2 transfected with the cAMP biosensor CAMYEL, were treated with coelenterazine h (5 μM, 10 min), followed by CCL2 (100 nM) or CCL7 (100 nM), either alone or pre-incubated with the indicated concentrations of EVA-A, followed by forskolin (10 μM, 10 min) to induce cAMP production. cAMP was detected 10 min after chemokine addition. Data are represented as a percentage of the inhibition of cAMP production observed upon chemokine treatment in the absence of EVA-A, and presented as mean ± SEM from three independent experiments. c Interactions of chemokine CC + 1 residues (sticks with mesh) with hydrophobic pocket side chains (sticks) of EVA-A, EVA-A(Y44A) and EVA-A(L39P). Top (left to right): EVA-A (grey) bound to CCL7 (sky blue) and EVA-A(Y44A) (green) bound to CCL7 (sky blue). Bottom (left to right): EVA-A(L39P) (deep blue) bound to CCL7 (sky blue) and EVA-A(Y44A) (green) bound to CCL2 (olive). d EVA-A(Y44A) (top) and EVA-A(L39P) (bottom) affinities (Kd) for wild type and CC + 1 residue-mutated chemokines (coloured as in Fig. 3e, f). Data are presented as mean ± SEM from three independent experiments. $, Kd < 0.1 nM; **p < 0.01, ***p < 0.001, ****p < 0.0001, versus wild type chemokine (two-tailed t test).

