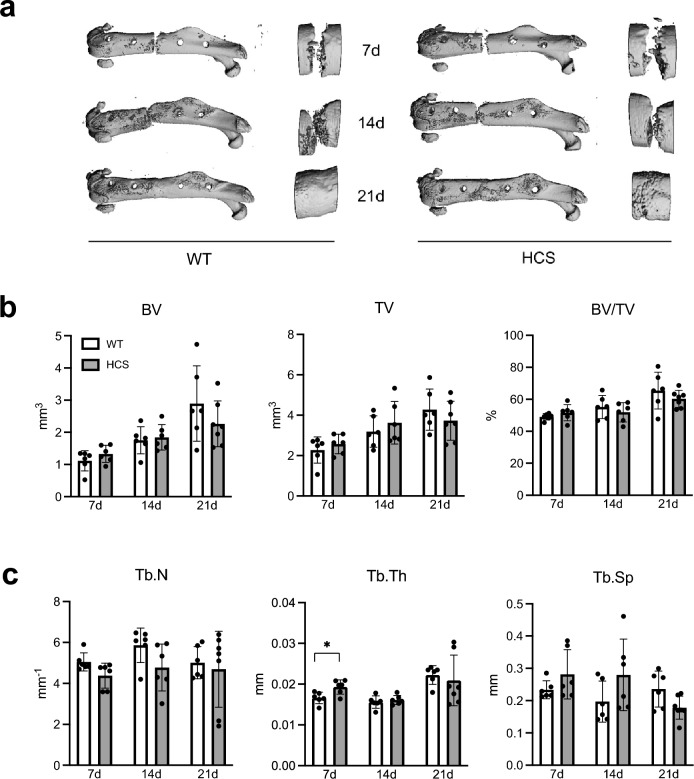
Figure 2.
Regular radiological healing process in HCS mice with femoral fracture. (a) Representative µCT images of the callus of WT and HCS mice 7, 14, and 21 days after osteotomy. Images were generated by SCANCO Medical microCT Analysis Software V6/10–2009, https://www.scanco.ch/images/Brochures/microct_sw_.v8.pdf, Brüttisellen, Switzerland (b) Quantification of bone volume (BV), tissue volume (TV) and bone volume per tissue volume (BV/TV). (c) Quantification of trabecular numbers (Tb.N.), trabecular thickness (Tb.Th.), and trabecular separation (Tb.Sp.) in the same groups. Non-parametric Mann–Whitney U test, *p < 0.05. Data are shown as mean with standard deviation. Data points indicate individual measurements from each mouse.

