Figure 3.
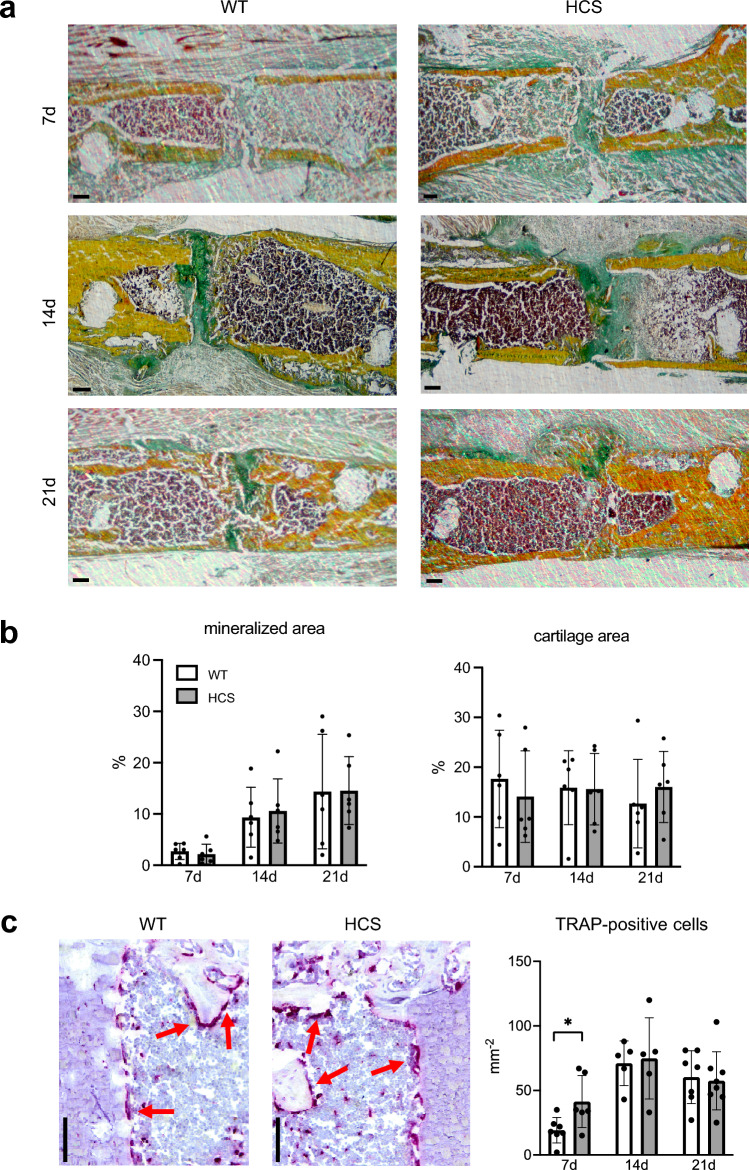
Normal histological callus maturation but increased osteoclast numbers in HCS mice. (a) Representative callus sections (Movat’s Pentachrome staining) of WT and HCS mice at the indicated time points (yellow = mineralized bone; green = cartilage; reddish/brown = bone marrow). Scale bar = 100 μm. Images were captured with CellSens Standard V4.1, Olympus, https://www.olympus-lifescience.com/de/software/cellsens/Tokio, Japan. (b) Histomorphometric quantification of static callus parameters (cartilage and mineralized area) in the same mice. (c) Representative images of tartrate-resistant acid phosphatase stainings 21 days after femoral osteotomy, osteoclasts are stained in red. The corresponding quantitative analysis is displayed on the right. Scale bar = 100 μm. For (a–c), non-parametric Mann–Whitney U test, *p < 0.05. Data are shown as mean with standard deviation. Data points indicate individual measurements from each mouse.

