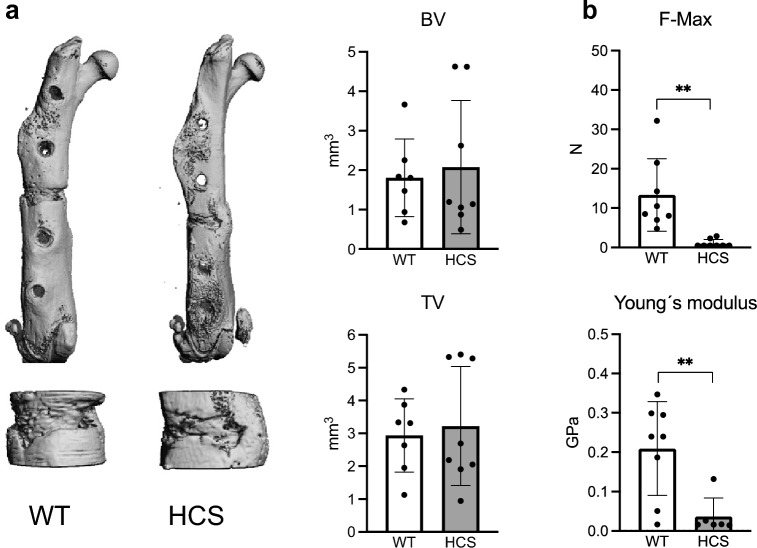
Figure 6.
Impaired biomechanical stability of healed femora in HCS mice. (a) Representative µCT images of the healing femur of WT and HCS mice 28 days after osteotomy. Upper row: overview. Lower row: detailed image of callus. Quantification of bone volume (BV) and tissue volume (TV) in the same mice. Images were generated by SCANCO Medical microCT Analysis Software V6/10–2009, https://www.scanco.ch/images/Brochures/microct_sw_v8.pdf, Brüttisellen, Switzerland (b) Quantification of mechanical properties of the healing femora as determined by three-point-bending test in the same animals. F-Max = maximum force that the bone could withstand; Young’s modulus = stiffness along the axis. Non-parametric Mann–Whitney U test, **p < 0.005. Data are shown as mean with standard deviation. Data points indicate individual measurements from each mouse.

