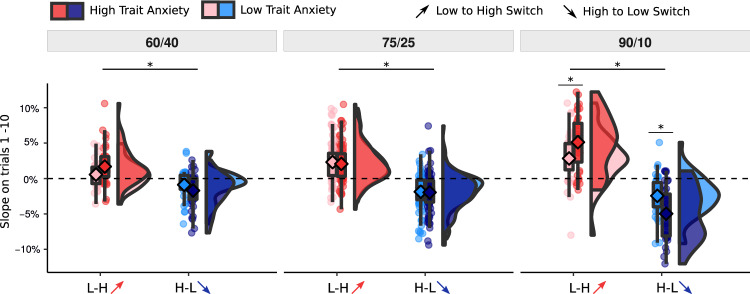
Fig. 4. Estimated slopes.
Slope of change of reported ratings on trials 1–10 following contingency reversal separately for each session and anxiety level. Anxiety was split by median for visualization purposes, but the statistical tests and corresponding asterisks reflect continuous relationships. Positive values indicate an increase in shock probability ratings while negative values indicate a decrease. The slope variable is shown using the original values, however, statistical tests were performed on absolute values. Slope was steeper in 90/10 compared to 60/40, t60<90 = −9.84, p < 0.001, η2p = 0.15 [0.10, 0.21], and 75/25, t75<90 = −7.19, p < 0.001, η2p = 0.38 [0.22, 0.51]. Trait anxiety was positively associated with slope in the 90/10 condition, F(1,233) = 13.39, p < 0.001, η2p = 0.05 [0.01, 12] (across L-H and H-L), Assessed by LMM, tests two-sided, post-hoc p-values Tukey corrected. Asterisks indicate significant post-hoc tests. The three conditions include N = 36, N = 88 and N = 37 individuals. Box covers interquartile range (IQR), mid-line reflects median, whiskers the +/−1.5 IQR range. Angled rectangles represent predictions of the fitted LMM model.

