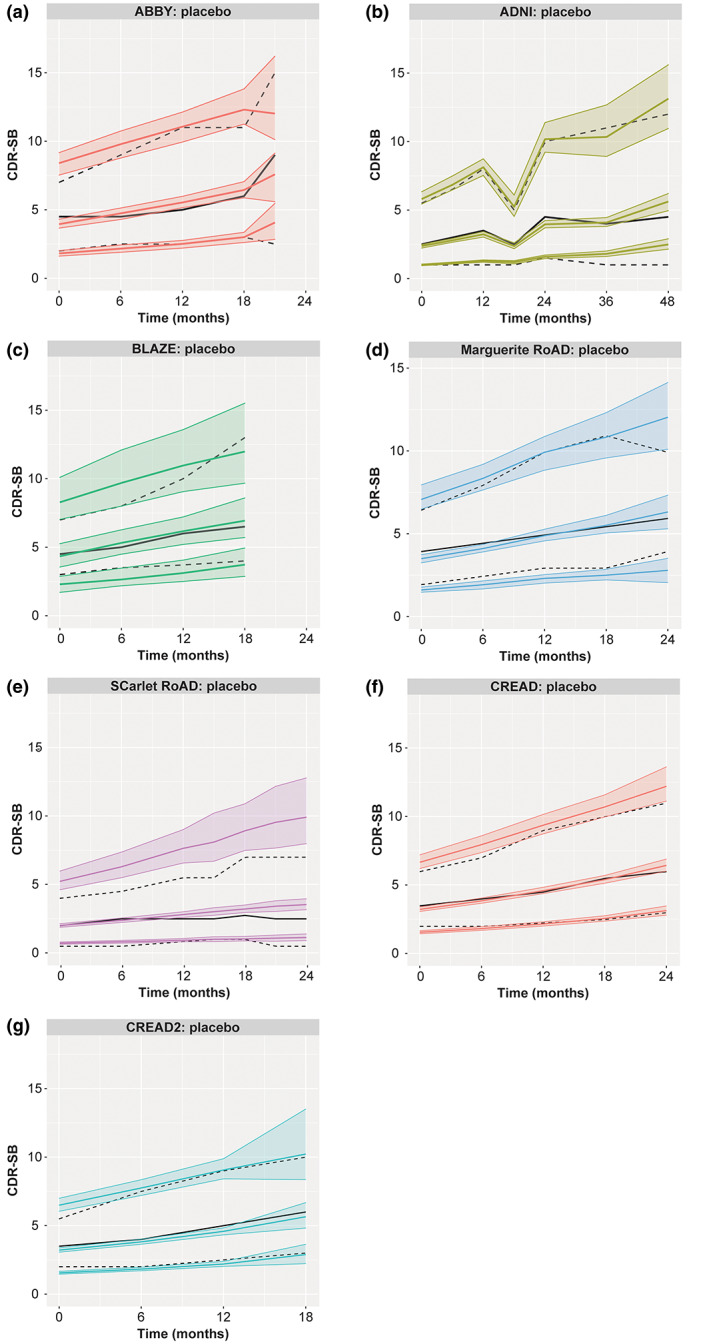
FIGURE 2.

VPC internal validation of the model in studies used for model development (a–e) and external validation of the model in studies not used for model development (f, g). *ADNI, Alzheimer's Disease Neuroimaging Initiative; CDR‐SB, Clinical Dementia Rating Scale – Sum of Boxes; CI, confidence interval; VPC, visual predictive check. Solid and dashed black lines are the observed median and 10th and 90th percentiles, respectively. Three predicted percentiles are shown in color for each of the observed metrics (solid line is median, shaded areas are 10th, and 90th percentiles). *Obtained from 1000 simulated datasets using the final model.
