
FIGURE 3.
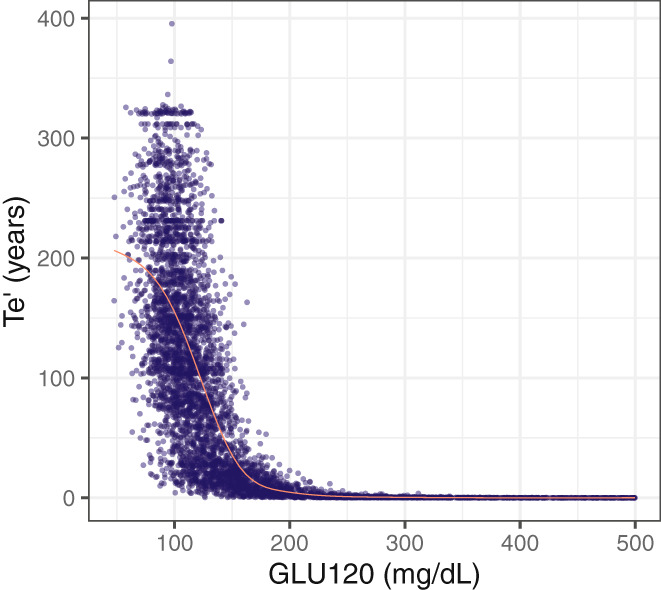
Effect of the time‐varying biomarker GLU120 on the Weibull scale parameter Te′. The data shown in this figure was obtained from 100 simulations for one subject. The red line represents the smooth line obtained using the generalized additive model smoothing method. GLU120, 120 min of oral glucose tolerance test; Te′, scale parameter of Weibull function.