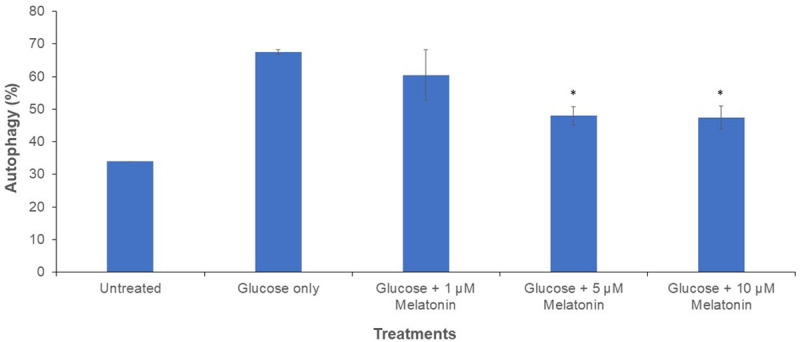
Figure 3.

Graph of autophagy activation after AO staining in Schwann cells after 24 h treatment with 100 mM glucose with or without melatonin of varying concentrations (1, 5 and 10 µM). “*” indicates the statistically significant difference (P < 0.05) in melatonin-treated groups are compared with the group treated with 100 mM glucose alone.
