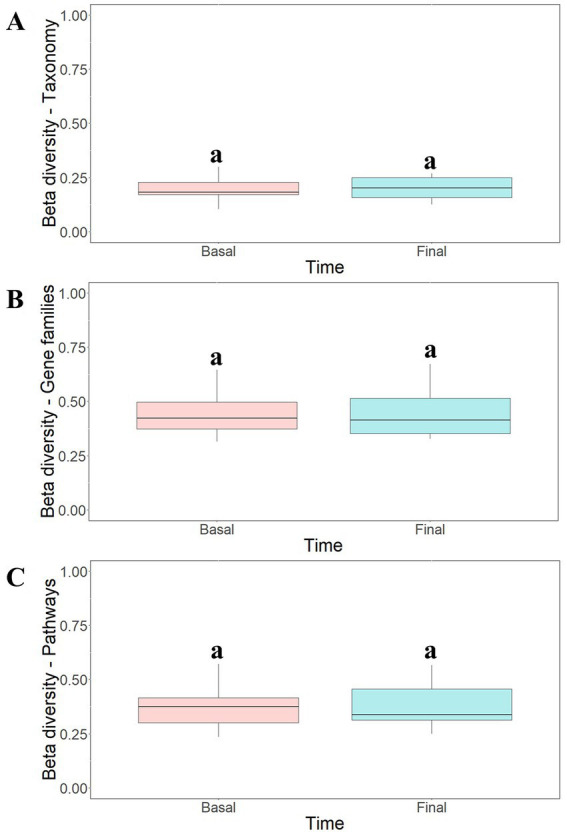
Figure 7.

Beta-diversity analysis of taxonomic profiles (A), gene families (B) and metabolic pathways (C) found in the microbiota of participants at different intervention periods: pre-administration (basal) and late administration (final). Bray-Curtis method was selected for the calculation. aNo statistically significant (p > 0.05) differences were found.
