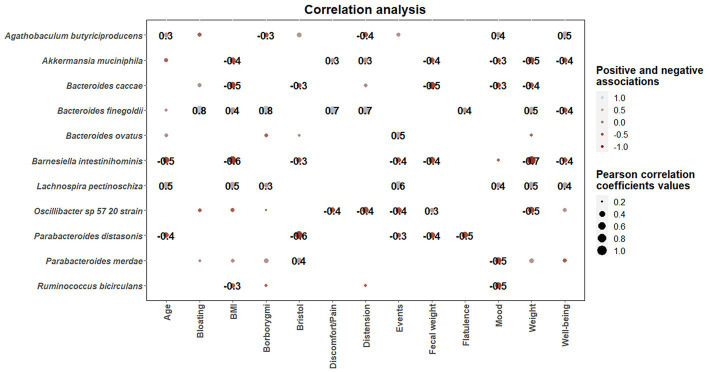
Figure 9.
Correlation heatmaps showing the associations between microbial species modulated by guar gum administration and clinical parameters. Blue and red dots indicate positive and negative correlations expressed as Pearson correlation coefficients. Color intensity and dot size are in proportion to magnitude. These correlations were statistically significant (p < 0.05). BMI, body mass index.

