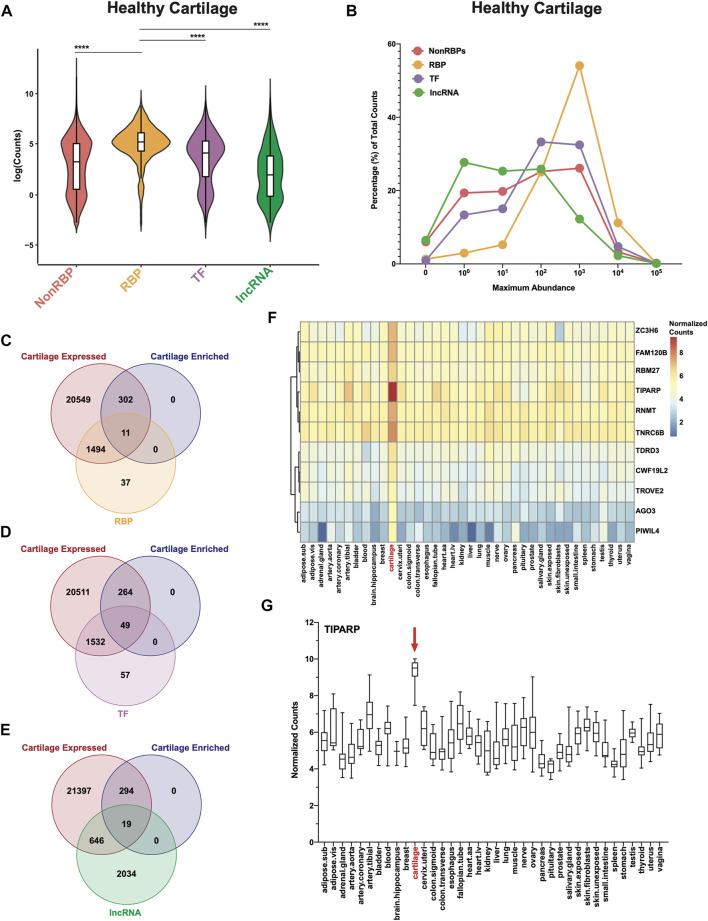
FIGURE 1.
RBPs are highly expressed and enriched in healthy human cartilage. (A) Log normalized RNA-seq counts for nonRBPs, RBPs, TFs and lncRNAs in healthy cartilage (n = 18). Box and whiskers plots showing the first and third quartiles. Center line at the median. Wilcoxon rank sum tests with continuity correction were used to determine statistical significance between expression of RBPs and all other categories. ****p < 2.2e-16. (B) Maximum abundance levels of nonRBPs, RBPs, TFs and lncRNAs are shown as percentage of total RNA-seq counts for each category. (C–E) Intersection of cartilage expressed genes (22,356; RNA-seq counts >0), GTEx cartilage-enriched genes (313) and RBPs (C), TFs (D) and lncRNAs (E). (F) Heatmap showing average normalized counts of cartilage-enriched RBPs compared to all other GTEx tissues. (G) TIPARP normalized counts for all samples across all GTEx tissues. Box and whiskers plot showing the first and third quartiles. Center line at the median. For all panels, cartilage bulk RNA-seq data from (Fisch et al., 2018).

