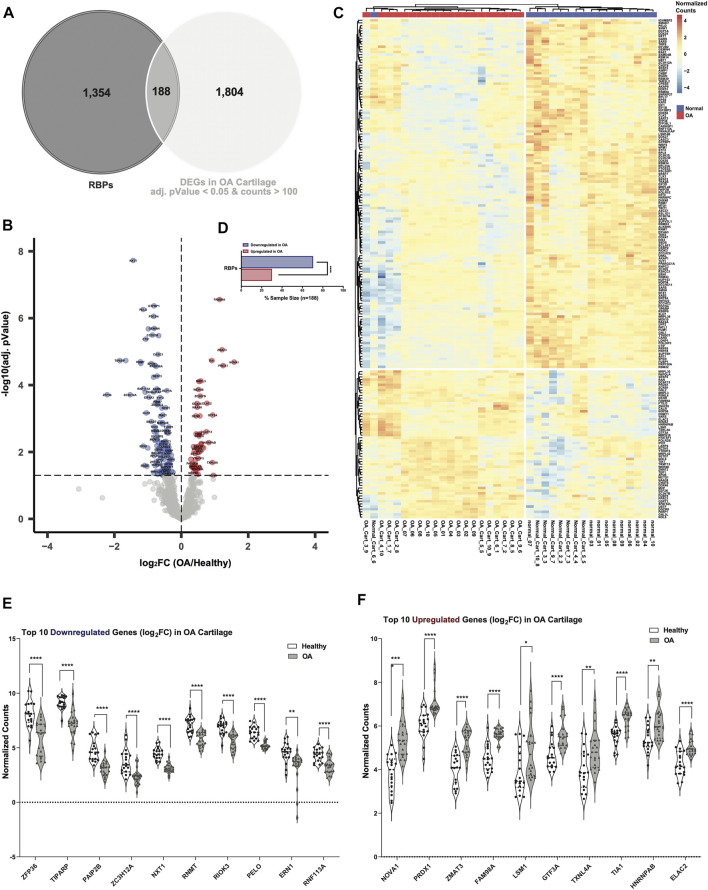
FIGURE 2.
Dysregulated RBPs in OA cartilage. (A) Venn diagram showing intersection of RBPs with DEGs in OA cartilage with healthy RNA-seq counts >100 and an adjusted p-value <0.05. (B) Volcano plot showing 188 DE RBPs. Blue indicates downregulation in OA cartilage compared to healthy, and red indicates upregulation. Gray indicates no significance. (C) Heatmap showing normalized expression of the 188 DE RBPs in healthy (n = 18, blue) and OA (n = 20, red) cartilage. (D) Bar chart showing proportion of downregulated (blue) vs upregulated (red) RBPs in OA cartilage. ****p < 0.0001 by comparison of proportions test. (E, F) Violin plots showing top 10 downregulated (E) and upregulated (F) RBPs by log2FC. Normalized counts for each gene shown on the y-axes. *p < 0.05, **p < 0.01, ***p < 0.001, ****p < 0.0001 by multiple unpaired student’s t tests. For all panels, cartilage bulk RNA-seq data from (Fisch et al., 2018).

