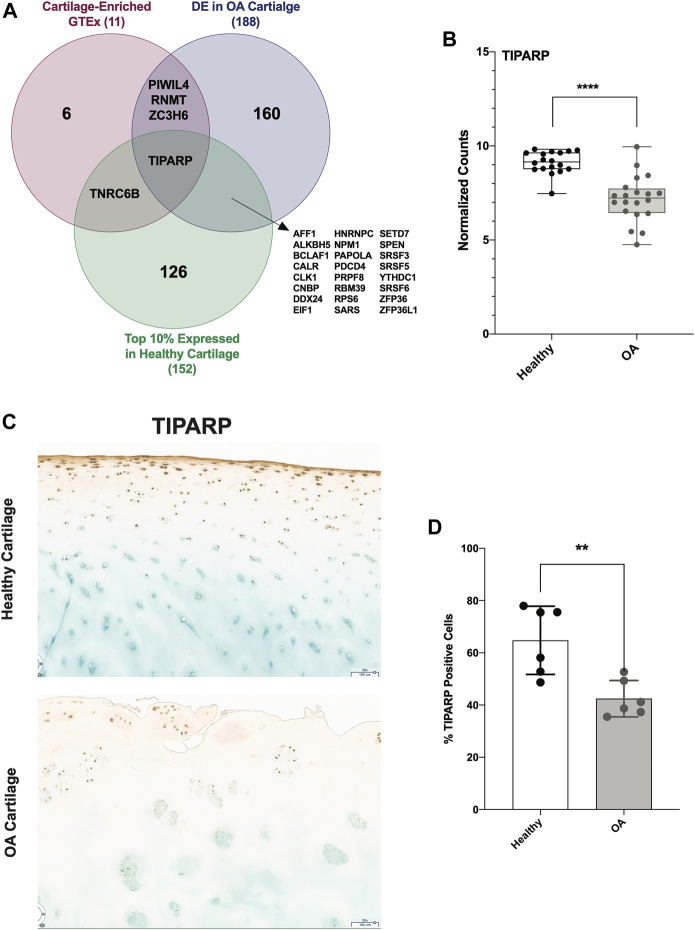
FIGURE 7.
TIPARP as a novel candidate therapeutic target in OA cartilage. (A) Venn diagram showing intersection of highly expressed (top 10%) RBPs in healthy cartilage, GTEx cartilage-enriched RBPs and DE RBPs in OA cartilage. (B) Box plot showing TIPARP normalized counts from healthy (n = 18) and OA (n = 20) cartilage samples. ****p < 0.0001 by unpaired Student’s t-test. For all panels, cartilage bulk RNA-seq data from (Fisch et al., 2018). (C, D) IHC (C) and quantification (D) of TIPARP protein in OA compared to healthy in articular cartilage. Error bars are standard deviation, n = 6 (healthy) and n = 6 (OA). *p<0.05 by two-tailed unpaired Student’s t-test.

