FIGURE 8.
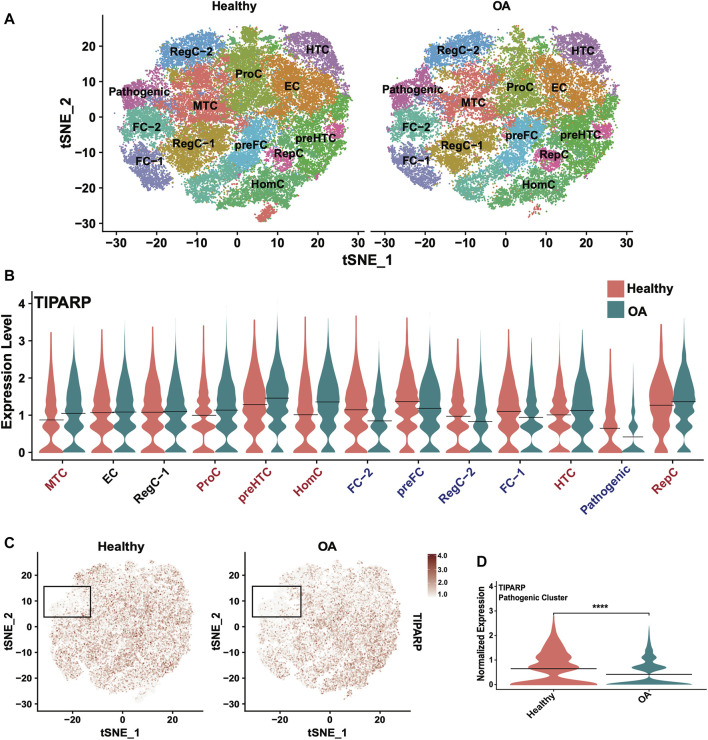
Single-cell RNA sequencing reveals differential TIPARP expression patterns in healthy and OA human cartilage. (A) Visualization of clustering by split tSNE plots of healthy (n = 6) and OA (n = 6) human cartilage samples using 0.5 resolution. (B) Violin plots showing cluster-specific TIPARP expression split by condition (healthy [pink] vs OA [blue]). TIPARP is upregulated in OA in clusters with red text, downregulated in OA in clusters with blue text, and unchanged in clusters with black text. (C) TIPARP expression in healthy vs OA cartilage visualized in split tSNE plots. The pathogenic cluster is indicated with black boxes. Normalized expression is shown in the color-coded scale. (D) Differential expression of TIPARP between healthy [pink] and OA [blue] in the pathogenic cluster. Black lines at the mean. ****p < 0.0001 by unpaired Student’s t-test. For all panels: RegC: regulatory chondrocytes, EC: effector chondrocytes, preFC: pre-fibrocartilage chondrocytes, FC: fibrocartilage chondrocytes, preHTC: pre-hypertrophic chondrocytes, HTC: hypertrophic chondrocytes, HomC: homeostatic chondrocytes and RepC: reparative chondrocytes. For all panels, cartilage scRNA-seq data from (Swahn et al., 2023).

