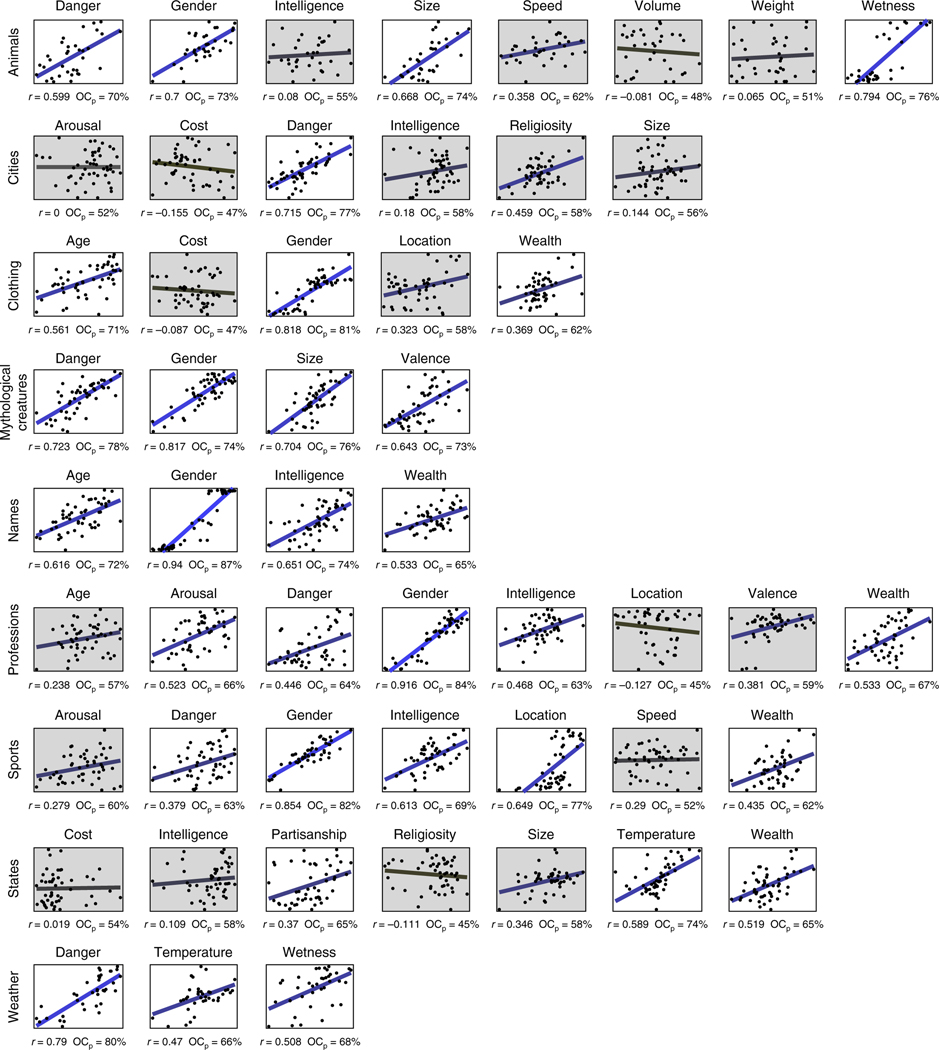
Fig. 4 |. Semantic projection predicts human judgements: detailed results.

For each of 52 category–feature pairs, scatterplots show the relationship between z scores of average item ratings across participants (; y axis) and ratings predicted by semantic projection (x axis). Correlation and pairwise order consistency () values are presented below each scatterplot. Experiments for which both of these measures were significant are shown over a white background. Straight lines are linear regression fits to the data and, across figures, vary according to correlation strength from black (weak) to blue (strong).
