
Fig. 4.
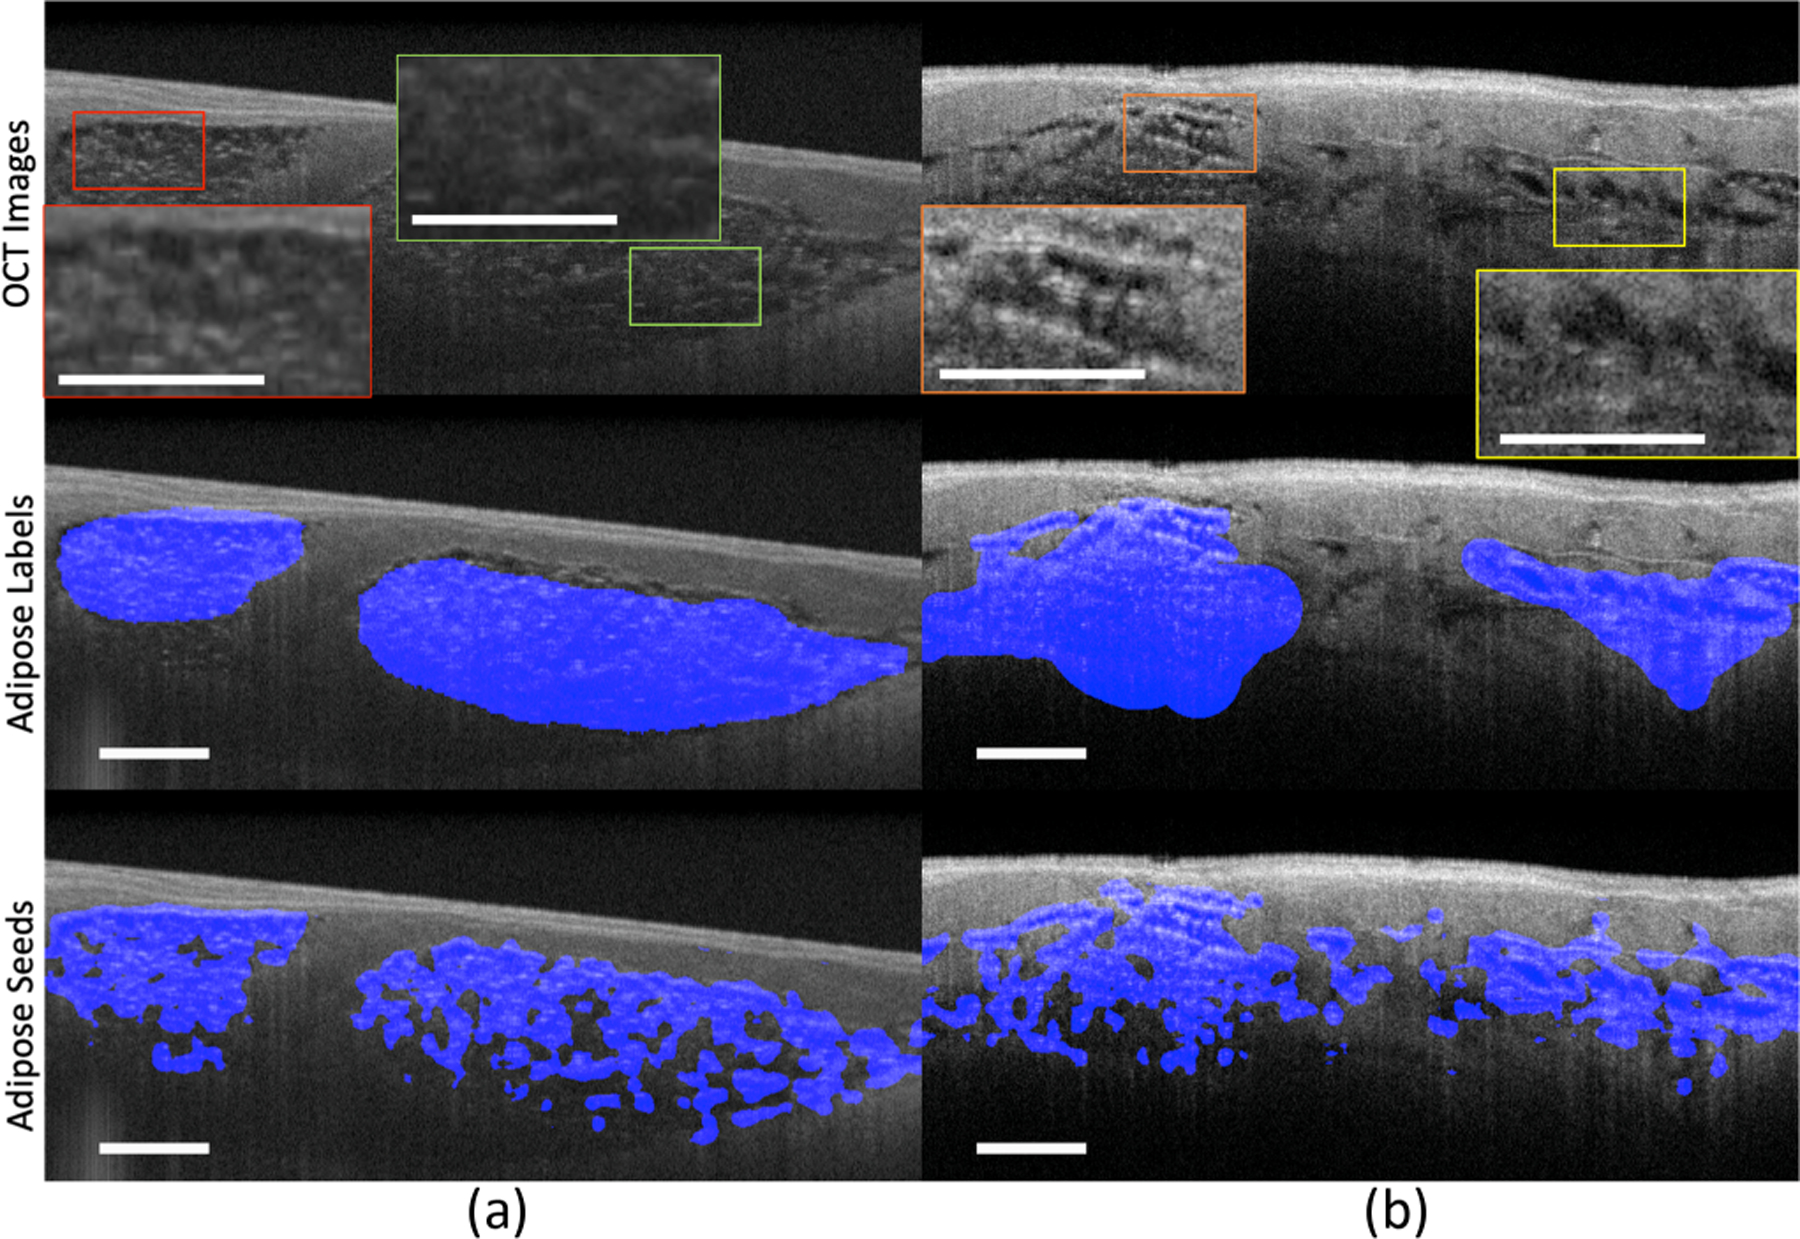
The tissue seed results in samples with different adipose features. Sample (a) is obtained from the left atrium. The highlighted regions in sample (a) are two regions with different focal statuses. The red box is within the focal plane while the green box is out of focus. Sample (b) is obtained from the right ventricle. The highlighted regions in sample (b) are with different tissue structures. The orange box is with multiple small fat cells while the yellow box is with a few big fat cells. Scale bar: 500 µm.