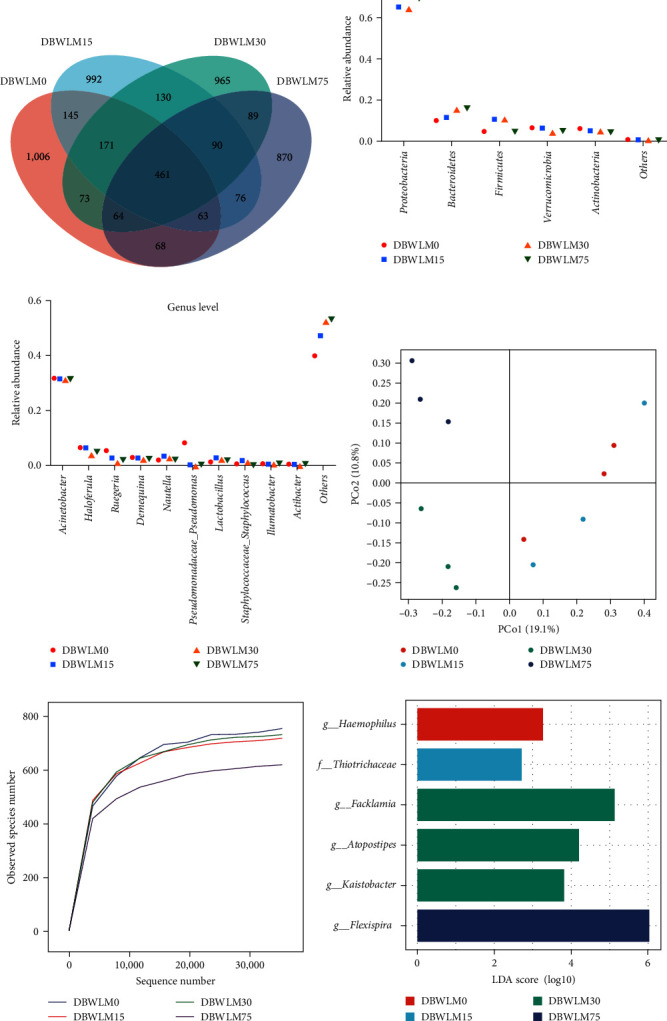
Figure 2.

Gut microbial community composition of P. vannamei fed DBWLM instead of fish meal. (a) Venn diagram showing the number of unique and shared OTUs. (b) The average relative abundance of the top five dominant phyla levels. (c) The average relative abundance of the top 10 dominant genera. (d) Principal coordinate analysis (PCoA). Each point represents a sample and points of the same color belong to the same group. (e) A sparse curve diagram measures the diversity of each sample to a certain extent. (f) Histogram of the difference-rich classification group (LEfSe, LDA > 3.5).
