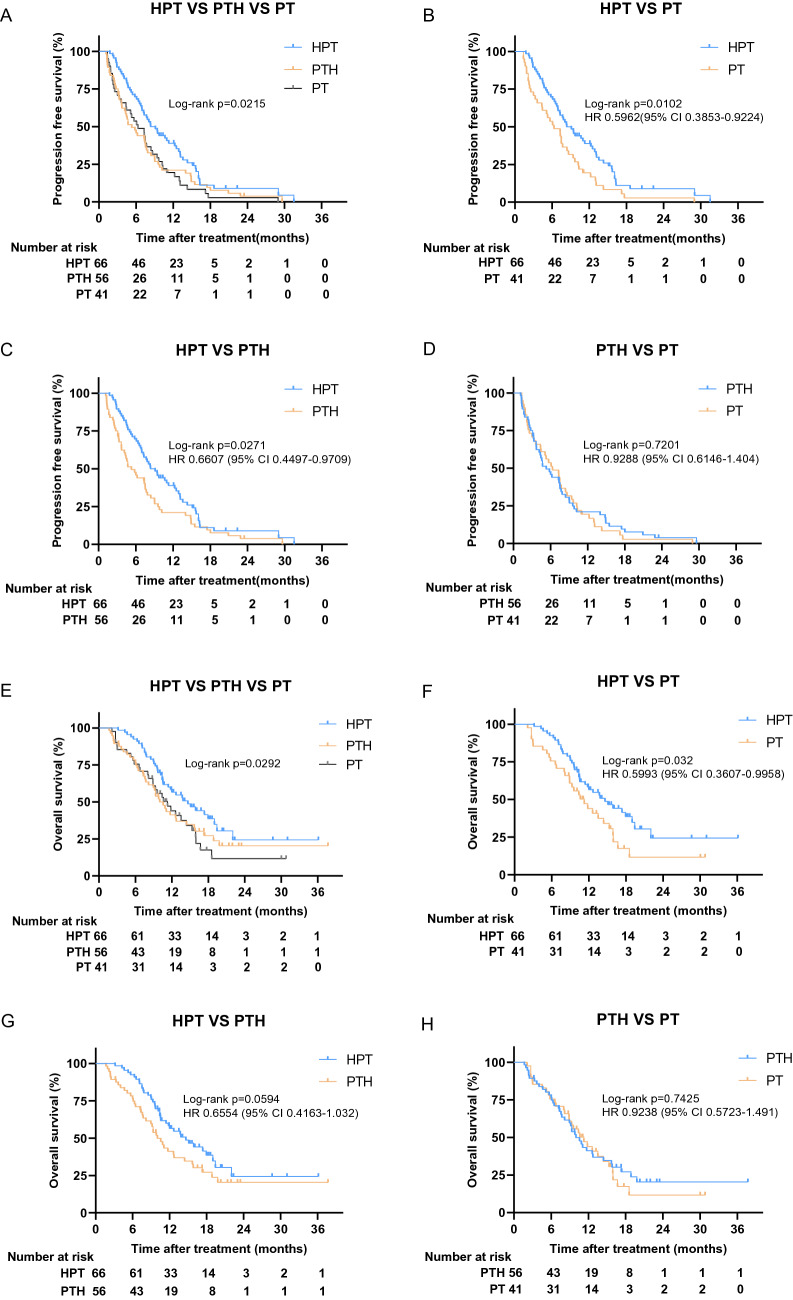
Fig. 2.
Kaplan–Meier curves of survival outcomes of patients in the three groups. A Comparison of progression free survival among three groups. B The PFS comparison between HPT and PT (B), HPT and PTH (C), PTH and PT (D). E Comparison of overall survival among three groups. The OS comparison between HPT and PT (F), HPT and PTH (G), PTH and PT (H). HPT initial hepatic artery intervention combined with immunotarget therapy; PTH immunotarget therapy sequential hepatic artery interventional therapy; PT immunotarget therapy only

