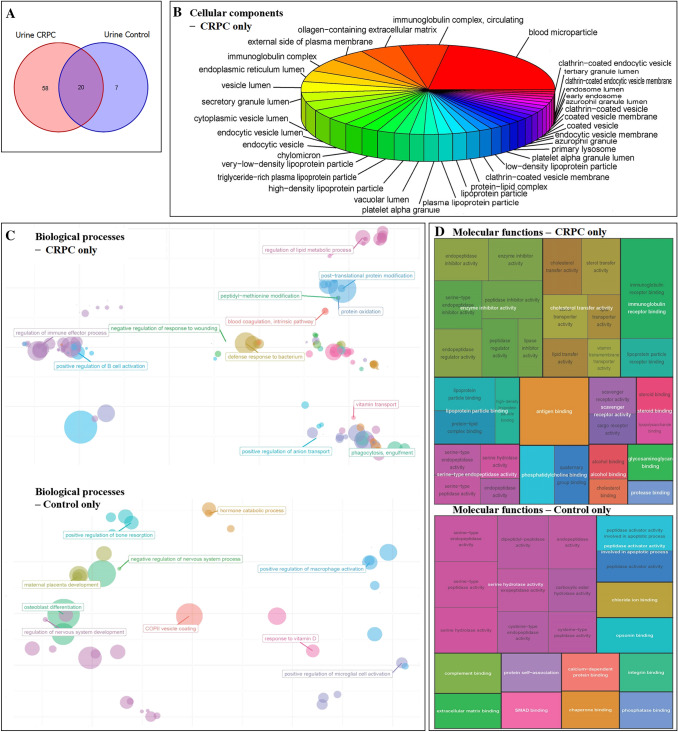
Fig. 3.
Proteomic analysis of CRPC and control urine-derived EV. A Venn diagram of the number of proteins identified in CRPC and control urine-derived EV. B Cellular component, C biological process, and D molecular function enrichment analyses of urine-derived EV proteins that are exclusive to the CRPC (n = 9) and control (n = 3) samples. Visualisation of cellular components is limited to CRPC urine-derived EV proteins since only one GO term was enriched for control urine-derived EV proteins (endoplasmic reticulum lumen, p-value = 0.0049, adjusted p-value = 0.088). GO terms enriched by 7 urine-derived EV proteins exclusive to controls were selected based on the significance level of adjusted p-value < 0.1

