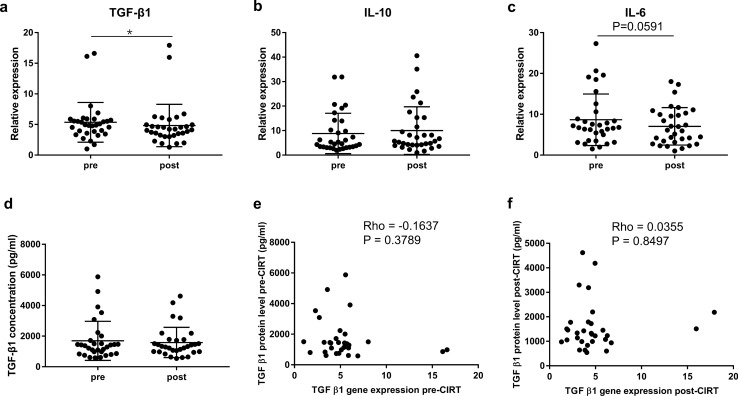
Fig. 6.
Cytokine mRNA and protein levels and correlations between mRNA and protein levels. Cytokine gene expression levels of (a) TGF-β1, (b) IL-10 and (c) IL-6 are shown before and after CIRT. N = 32 CIRT patients are included. (d) Plasma TGF-β1 concentration is shown before and after CIRT. N = 31 CIRT patients are included. (e, f) Correlations between gene and protein levels of TGF-β1 at pre-CIRT or post-CIRT timepoint. N = 31 patients are included. Significant difference is depicted as *p < 0.05

