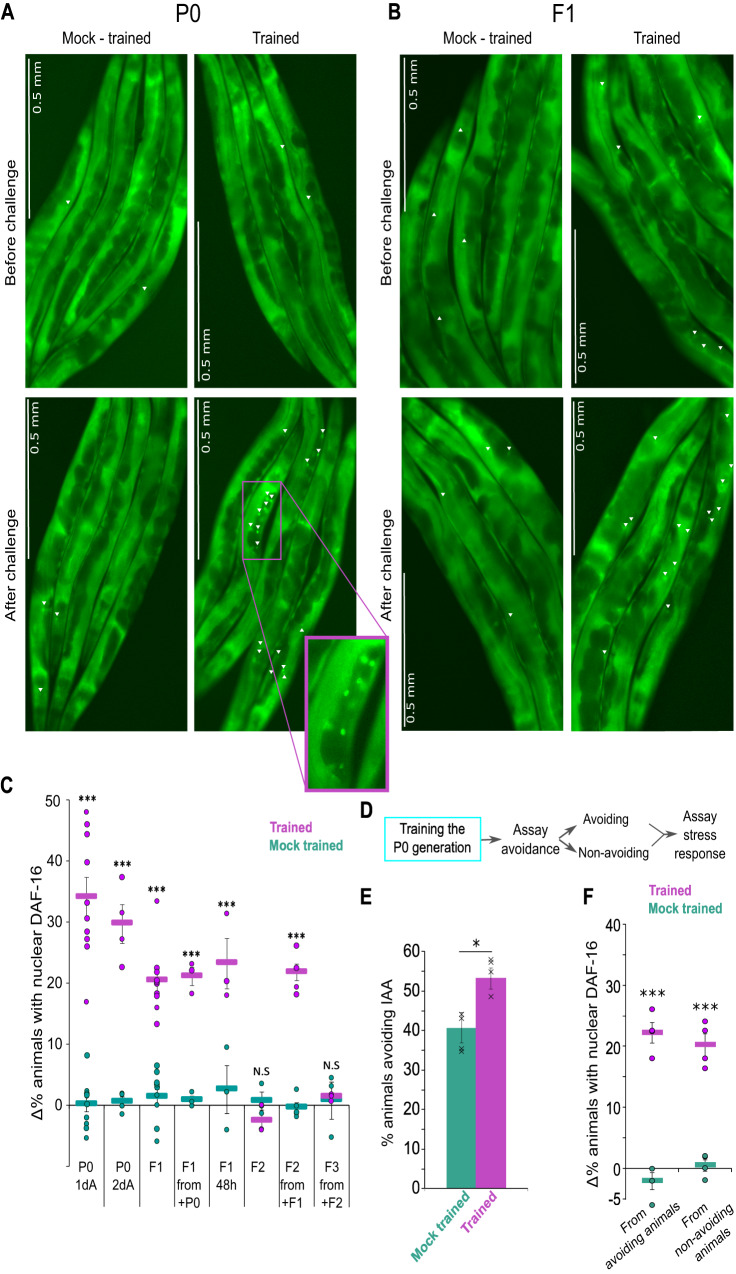
Fig. 3. Acquired cellular changes are transmitted up to the F2 generation, and are presumably decoupled from the memory-evoked avoidance behavior.
A, B Odor challenge induced a rapid (<20 min) translocation of DAF-16/FOXO to cells’ nuclei. Shown are representative images of trained and mock-trained P0 (A) and F1 (B) animals before and after exposure to IAA (challenge). Nuclear translocation of DAF-16/FOXO was observed primarily in the gonad sheath cells (white arrowheads) and was visualized using a translational fusion of the protein to GFP83. We scored animals as initiating a stress response if at least six cells (in both gonad arms) showed nuclear DAF-16/FOXO localization. Mock-trained animals typically had ≤2 cells with nuclear DAF-16/FOXO (an extensive statistical validation for this scoring approach is found in3). Inset is a zoom-in image demonstrating the nuclear localization of DAF-16. Note images were cropped to allow zooming into the gonad sheath cells. C Quantification of the stress response based on the percent of animals detected with nuclear DAF-16/FOXO following exposure to training odorant IAA. Trained and mock-trained animal groups were each scored before and after challenging the animals with IAA. % of worms with nuclear DAF-16/FOXO before the challenge were subtracted from the % of worms with nuclear DAF-16/FOXO after the challenge (thus, presented as Δ%). Negative Δ% values could arise if % of animals with nuclear DAF-16/FOXO following the IAA challenge were lower than the % before the challenge (see Supplementary Fig. 1 for extended description and the raw data used to derive these values). +P0/+F1/+F2 denote that the assayed animals were descendants of animals in which the stress response was induced. 1dA and 2dA are 1- and 2-day-old adults, accordingly. 48 h denotes that the assayed F1s hatched 48 h post the recovery of the trained P0 animals. Otherwise, assays were performed on F1s that hatched 24 h following recovery of the P0-trained animals, thus, F1s were not exposed to the training conditions in their embryonic stage. Shown are the mean ± SEM of N = 3–10 biologically independent experimental repeats, each scoring >50 animals. Significance comparisons are between trained and mock-trained animals. P-values from left to right: 3.8E−20, 2.2E−16, 3.2E−13, 2.5E−14, 2.2E−7, 0.19, 6E−13, 0.9. ***p < 0.0005 (two-sided proportion test, after Bonferroni correction). D Experimental design to test the coupling between behavioral avoidance and stress induction following exposure to the training odorant IAA. Trained and mock-trained P0 animals were first assayed for their odor-evoked avoidance capacity. Avoiding and non-avoiding animals were separately grouped, and each group was subsequently assayed for odor-evoked stress induction as manifested by DAF-16/FOXO nuclear translocation. For this we used the strain CF193486. E Fraction of trained and mock-trained CF1934 animals that avoided IAA. Shown is the mean ± SEM of four independent experimental repeats, where each repeat consists of >50 animals from each group of animals. *p = 0.01 (two-sided proportion test after Bonferroni correction). Avoiding and non-avoiding animals from trained and mock-trained animals were then separately grouped. F Analysis of stress induction in the avoiding and the non-avoiding groups of both trained and mock-trained animals as collected following the behavioral assays shown in (E). Shown are the mean ± SEM of four independent experimental repeats, each scoring >50. Significance comparisons are between trained and mock-trained animals. P-values from left to right: 2.4E−7, 1.38E−5. ***p < 0.0005 (proportion test, two-sided, after Bonferroni correction). Source data is provided as a Source Data file.

