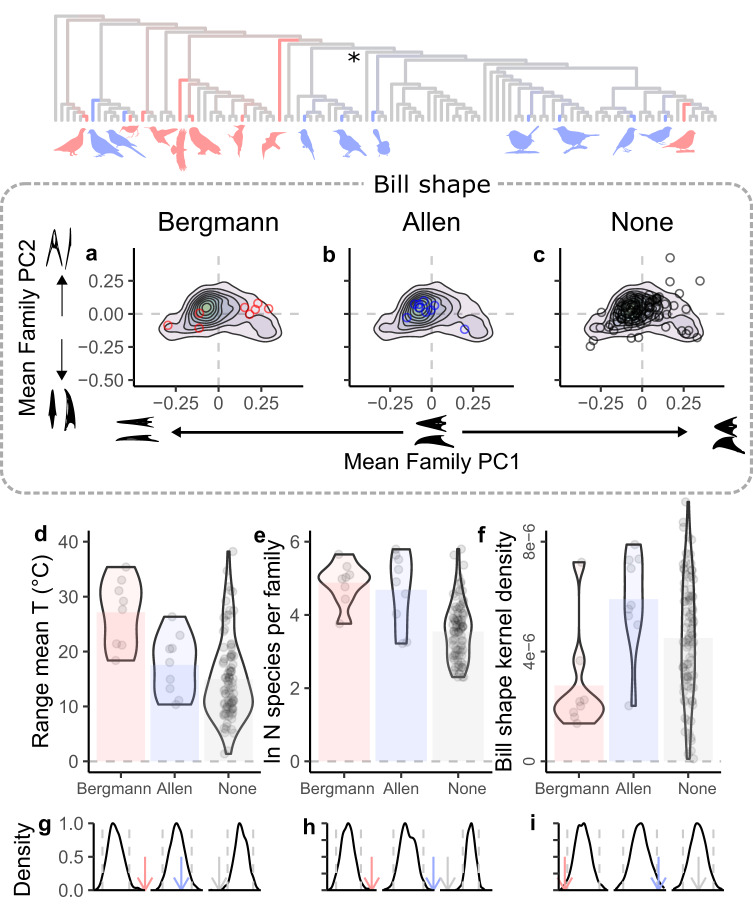
Fig. 4. Family-level traits are associated with conformity to Bergmann’s and Allen’s rules.
Cladogram without branch-length information showing family-level conformity to Bergmann’s (red) and Allen’s rule (blue). Icons depict representative taxa from conforming families and the asterisk denotes the ancestral node of passerines. Bill specialization can be estimated through bill shape characterization through a geometric morphometrics approach (see methods, i.e., contour lines for kernel densities in a–c indicate the rarity of a given shape). Silhouettes represent bill shapes that correspond to positions in PC 1 and 2. Families that conform to Bergmann’s rule (red circles) tend to occur in the periphery of bill morphospace (a), whereas families that either conform to Allen’s rule (blue circles) or neither rule (gray circles) tend to be more centrally located (b, c). Randomization models indicate that family-level factors that increase statistical power (i.e., extent of the temperature gradient for Bergmann, d, and sample size for both Bergmann and Allen, e) or that indicate bill specialization (f) tend to be higher in families that conform to these biological rules. Column heights in d–f depict family means and violin plots depict variation in the number of species per family across the range of each variable of interest. Randomization tests (g–i) confirm findings in a–f by showing that the corresponding observed values for these traits (arrows) lie outside the 95% interval of their expected null distribution (gray dashed lines). We thank Andy Wilson, xgirouxb, Ferran Sayol, Margot Michaud, Liftarn, Abraão B. Leite, Michael Scroggie, Metallura and Martin Bulla making their artwork available on Phylopic under Creative Commons licenses (CC-BY-SA, CC-BY, CC0—see Supplemental Information52; https://creativecommons.org/licenses/by-sa/4.0/).

