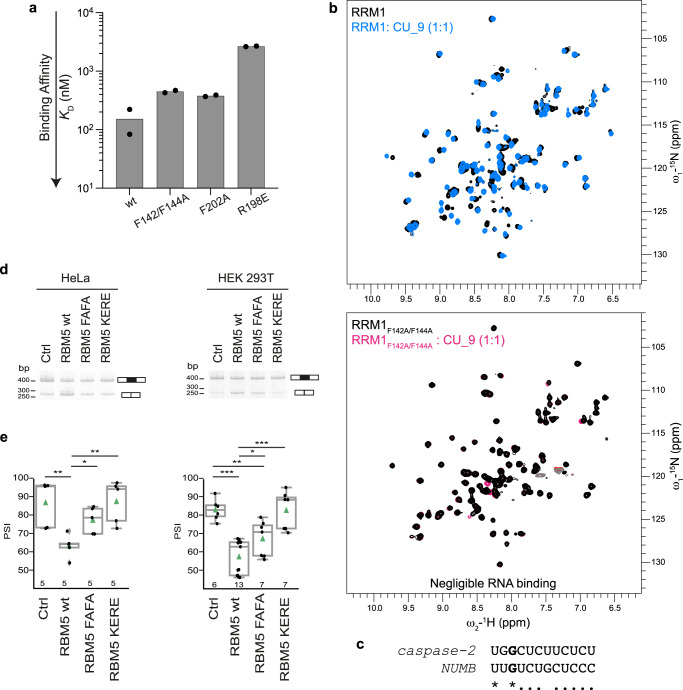
Fig. 4. Mutational analysis of RRM1-ZnF1.
a RNA binding contribution of specific residues of RRM1 and ZnF1, as probed by measuring binding affinity of RRM1-ZnF1 point mutants to GGCU_12 RNA using ITC. The bar plot shows the calculated dissociation constant (KD) from an average of two measurements and the individual data points are shown as black dots. b A superposition of 1H-15N HSQC spectra of RRM1 wild-type in free (black) and in presence of CU_9 RNA (sky blue) at a protein:RNA ratio of 1:1 is shown in the upper panel. A double mutant in RRM1 RNP1 residues (F142A/F144A) does not bind RNA as seen by a superposition of 1H-15N HSQC spectra of RRM1F142A/F144A mutant in free (black) and in presence of CU_9 RNA (pink) at a protein:RNA ratio of 1:1 in the lower panel. c Sequence alignment of caspase-2 derived RNA sequence used for in vitro studies and the RBM10 binding CLIP-Seq consensus motifs used for the construction of NUMB minigene reporter23. (*) indicates identity and (.) indicates similarity due to a pyrimidine to pyrimidine substitution. d HeLa and HEK 293T cells were co-transfected with RG6-NUMB alternative splicing reporter23 and T7-RBM5 vectors expressing wild type or RNA binding affinity mutants in the RRM1 (F142A/F144A->FAFA) or ZnF1 (K197E/R197E->KERE) or control vector, as indicated. Pattern of alternative splicing isoforms was detected by RT-PCR using primers complementary to vector sequences flanking exons of the RG6-NUMB minigene; the positions of the amplification products corresponding to exon 9 inclusion/skipping are indicated. The results correspond to one representative replicate of the experiment. Uncropped gels are provided in Source Data. e Quantifications of alternatively spliced isoforms shown in panel d for the number of biological replicate experiments indicated at the bottom of each bar were used to generate the boxplots shown (bottom panel). The box represents the interquartile range from the 25th percentile to the 75th percentile, the median is represented by the line in the box. The whiskers represent the minimal and maximal values and the outliers are plotted as gray diamonds. The means are indicated with the green triangles, each black dot represents a biological replicate. T-test (two-tailed distribution, homoscedastic) results are indicated (*<0.05, **<0.01; ***<0.001). Source data are provided as a Source Data file.

