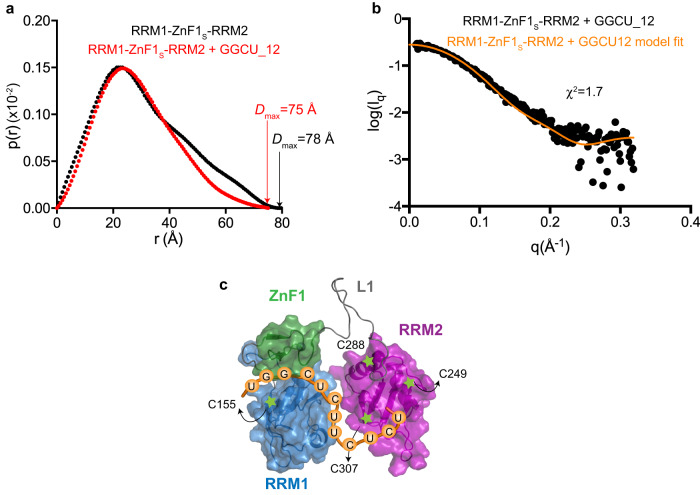
Fig. 5. Domain arrangement of RRM1-ZnF1-RRM2.
a Comparison of SAXS p(r) curves showing maximum pairwise distribution of RRM1-ZnF1S-RRM2 free (black) and in complex with GGCU_12 RNA (red). Dmax is indicated for the respective SAXS curves. b The fit between experimental SAXS data for RRM1-ZnF1S-RRM2 bound to GGCU_12 RNA against the simulated data from the top PRE-based model is plotted, as obtained using Crysol software, the χ2 value is indicated. c Structural model of RRM1-ZnF1S-RRM2 in the presence of RNA, as calculated based on PRE and SAXS data. Positions of spin labels are marked and the domains are shown in surface representation. Source data are provided as a Source Data file.

