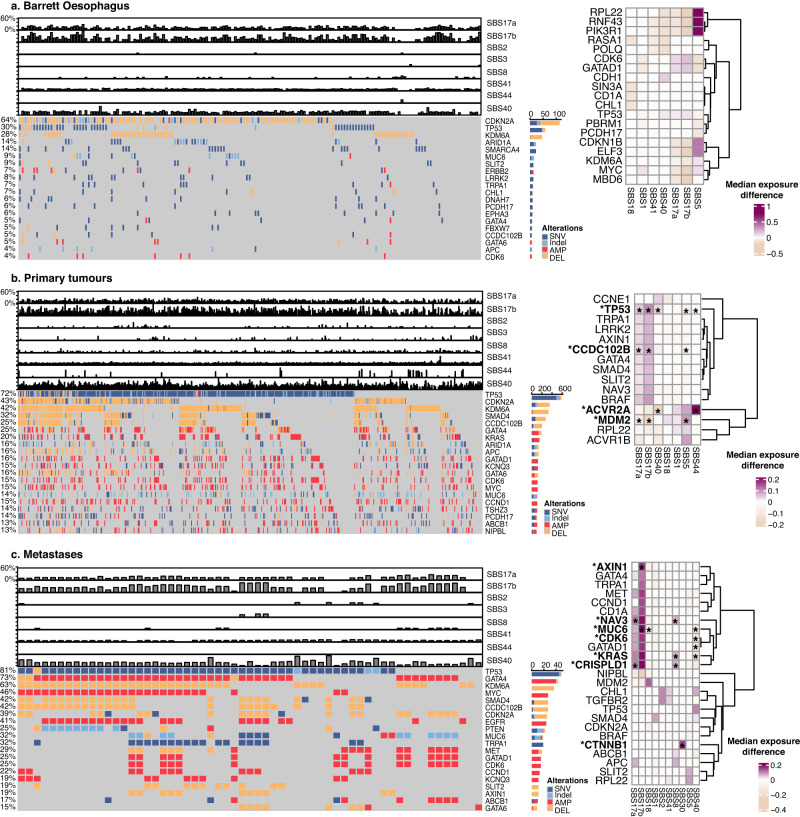
Fig. 3. Cancer drivers across disease stages and mutational signature prevalence.
The landscape of cancer driver events and their association with mutational signatures are depicted for (a) Barrett Oesophagus (n = 161), (b) primary tumours (n = 777) and (c) metastatic samples (n = 59). Left: The mutational and copy number alteration landscape of OAC drivers is shown in parallel with the contribution of key mutational signatures (top bar plots). The fraction of samples with alterations in a specific gene is shown on the left and in the bar plots on the right. Differennt alteration types are denoted with different colours. SNV = single nucleotide variant, AMP = amplification, DEL = deletion. Right: Heat maps depicting the increase (values >0) or decrease (values <0) in mutational signature prevalence in samples harbouring mutations or copy number changes in specific genes. The colour gradient indicates the median change in exposure compared to wild type. Only significant changes of >10% (in either direction) are depicted with Wilcoxon rank-sum two-sided test p-value <0.05. Stars indicate associations that are still significant after FDR multiple testing correction. Source data are provided as a Source Data file (including p-values).

