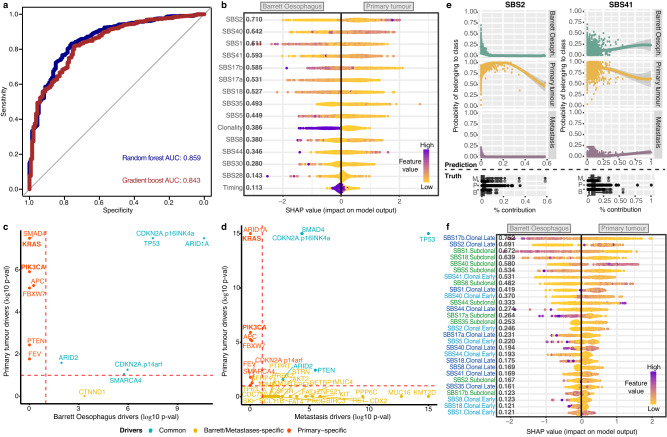
Fig. 4. Mutational processes and driver events distinguishing primary tumours from Barrett Oesophagus genomes.
a Performance of the gradient boosting and random forest signature-based classifiers in distinguishing between Barrett Oesophagus and primary tumours. The area under the curve (AUC) is indicated for either model. b Output of xgboost model distinguishing Barrett Oesophagus from primary tumours based on overall signature prevalence, while accounting for clonality and timing. Features are ordered according to their ranking in the model (top ranking features first). Every dot is a sample and the colour corresponds to the signature contribution in that sample, ranging from purple (highest contribution of the respective signature across the cohort) to yellow (lowest contribution of the respective signature). For ‘clonality’/‘timing’ purple denotes clonal/early and yellow denotes subclonal/late. c Genes positively selected in primary tumours versus Barrett Oesophagus. Genes commonly positively selected in all tumours are highlighted in blue. Genes positively selected only in the primary tumour group are highlighted in red, only in Barrett Oesophagus in yellow. KRAS and PIK3CA mutational events, specific to primary tumours, are highlighted in bold. The log likelihood-ratio test p-values are reported, adjusted for multiple testing using the Benjamini-Hochberg method. d Genes positively selected in primary tumours versus metastases are shown similarly as in (c). The log likelihood-ratio test p-values are reported, adjusted for multiple testing (Benjamini-Hochberg method). e Multinomial regression classifier results distinguishing Barrett Oesophagus, primary tumours and metastases based on signature prevalence. The predictive power of SBS 2 and 41 in distinguishing primary tumours is exemplified. The top panel shows the predicted disease stage depending on increasing mutational signature prevalence. The bottom panel shows the true distribution of mutational contributions for the selected signatures among three stages, with the centerline of boxes depicting the median exposure, the bottom and top box the first and third quartiles, and upper and lower whiskers extending from the hinges to the largest and smallest values, respectively, no further than 1.5* the inter-quartile range. (M = metastasis; P = primary tumour; B = Barrett Oesophagus). The curves in the prediction model were fitted with a loess function (shaded areas depict the 95% confidence interval). f Output of xgboost model distinguishing Barrett Oesophagus from primary tumours based on detailed signature contributions split by clonality and timing. Early clonal events ar depicted in light blue, late clonal events in dark blue and subclonal events in green. The individual dots are coloured as described in (b). Source data are provided as a Source Data file.

