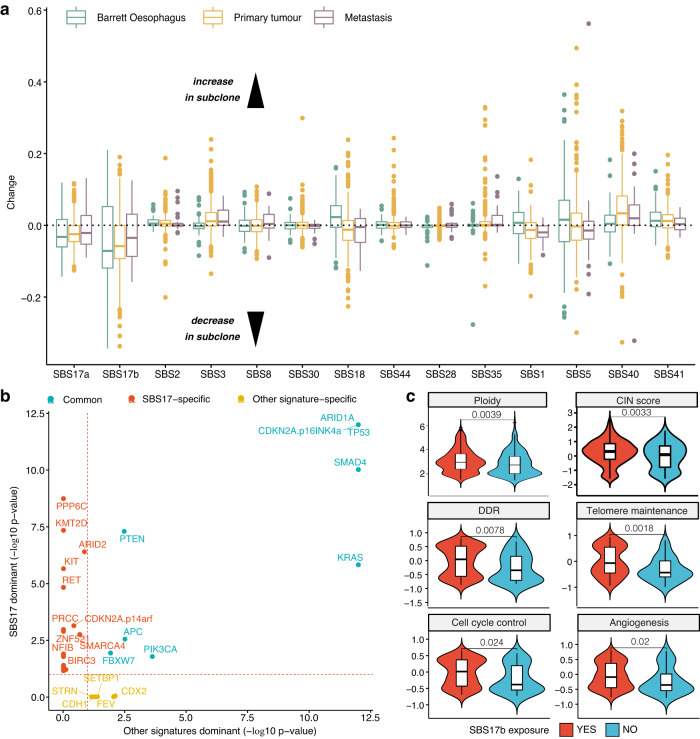
Fig. 6. Tumour clonal heterogeneity reveals widespread SBS17 shifts that correlate with changes in cellular phenotypes.
a Changes in signature exposure in tumour subclones. Values below 0 indicate a decrease in signature exposure in the sublones, values above 0 an increase. Signatures SBS17a and b are the only ones showing a dominant decrease across Barrett (n = 89, green), primary (n = 512, yellow) and metastatic (n = 38, purple) stages. Box boundaries represent first and third quartiles, centerline indicates median values. The upper and lower whiskers extend from the hinges to the largest and smallest values, respectively, no further than 1.5* the inter-quartile range. Outlier points are plotted individually. b Positively selected genes in primary tumours with a dominant SBS17 signature versus the ones positively selected in tumours with other dominant signatures. Genes commonly positively selected in both categories are highlighted in blue. Genes positively selected only in the SBS17 dominant group are highlighted in red. c The presence of SBS17b is associated with an increase in ploidy and chromosomal instability (CIN), as well as higher activity of telomere maintenance, DNA damage repair (DDR), cell cycle control and angiogenesis pathways. The YES category (red) denotes samples with SBS17b exposure >5% (n = 831 for genomic measurements; n = 167 for transcriptional hallmarks), while the NO category (blue) refers to exposures <=5% (n = 164 for genomic measurements; n = 36 for transcriptional hallmarks). Box boundaries represent first and third quartiles, centerline indicates median values. The upper and lower whiskers extend from the hinges to the largest and smallest values, respectively, no further than 1.5* the inter-quartile range. Two-sided Wilcoxon signed-rank test p-values are displayed. Source data are provided as a Source Data file.

