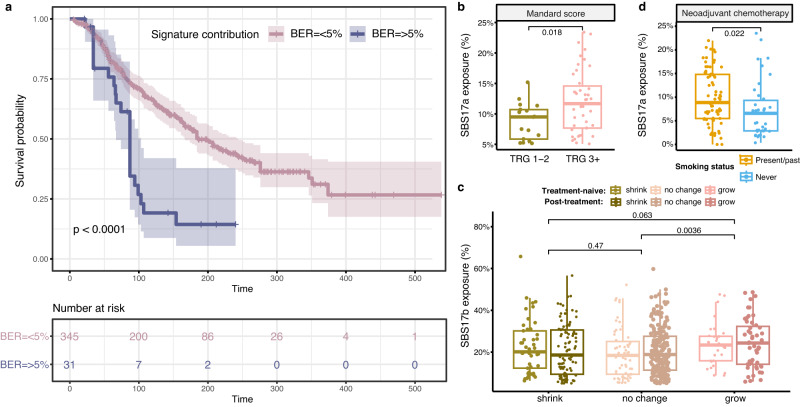
Fig. 7. Associations between mutational signatures and clinical outcomes.
a Patients with a BER signature prevalence >5% have a significantly worse overall survival outcome, as depicted by Cox proportional hazards analysis (Cox model log-rank p = 7.3e-06). The shaded areas depict the 95% confidence intervals. The log-rank test p-value is reported. The number of patients at risk at various time intervals are shown in the table below. b Prevalence of the SBS17a signature in treatment naïve tumours, compared between patients with Mandard scores TRG 1-2 (n = 17) versus TRG 3 or higher (TRG 3 + , n = 43). The centerline of boxes depicts the median values; the bottom and top box edges correspond to the first and third quartiles. The upper and lower whiskers extend from the hinges to the largest and smallest values, respectively, no further than 1.5* the inter-quartile range. A two-sided Wilcoxon signed-rank test p-value is displayed. c Prevalence of the SBS17b signature in tumours that shrunk (n = 145), showed no change (n = 242) or grew (n = 83) after surgery. The change in tumour volume (T stage) was calculated from pre-treatment staging to post-therapy resection pathology staging. The tumours are further split based on whether the sequencing was performed on the treatment-naïve (n = 136) or post-treatment (n = 334) sample. No major differences are observed based on treatment status, but an increase in SBS17b is seen in tumours growing after surgery. The groups are coloured according to treatment and volume change. Box boundaries represent first and third quartiles, centerline indicates median values. The upper and lower whiskers extend from the hinges to the largest and smallest values, respectively, no further than 1.5* the inter-quartile range. Two-sided Wilcoxon signed-rank test p-values are displayed. d SBS17a signature prevalence in post-treatment tumour samples from non-responders to neoadjuvant chemotherapy (i.e., patients showing stable or progressive disease), compared between present/past smokers (n = 71, orange) and never smokers (n = 38, blue). Higher SBS17a contributions are observed in smokers. Box boundaries represent first and third quartiles, centerline indicates median values. The upper and lower whiskers extend from the hinges to the largest and smallest values, respectively, no further than 1.5* the inter-quartile range. A two-sided Wilcoxon signed-rank test p-value is displayed. Source data are provided as a Source Data file.

