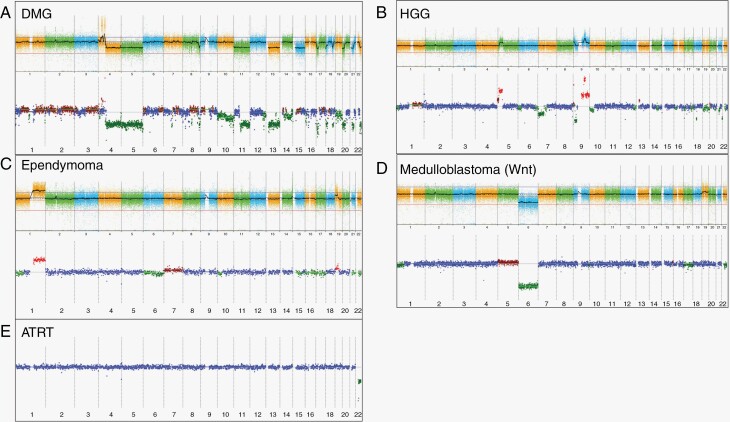
Figure 2.
Representative copy number arrays. Copy number profiling from a variety of histopathological diagnoses. Results of the OncoScan analysis of the primary tumor are displayed above and liquid biopsy iChor copy number plot below for each case. The log2ratio is plotted on the y-axis against chromosome numbers 1-22 on the x-axis. Red indicates a copy number gain, green indicates a copy number loss, and blue indicates a neutral copy number. A Diffuse midline glioma notable for PDGFRA amplification, and a variety of whole and partial chromosome losses. B High-grade glioma with 5p gain and complex chromosome 9 gains and losses as well as additional partial chromosome gains and losses. C Ependymoma with 1q gain, a known poor prognostic marker, also 19p gain. D Medulloblastoma with evidence of monosomy 6, consistent with Wnt subgroup medulloblastoma. E AT/RT with chromosome 22 deletion, harboring SMARCB1 gene.

