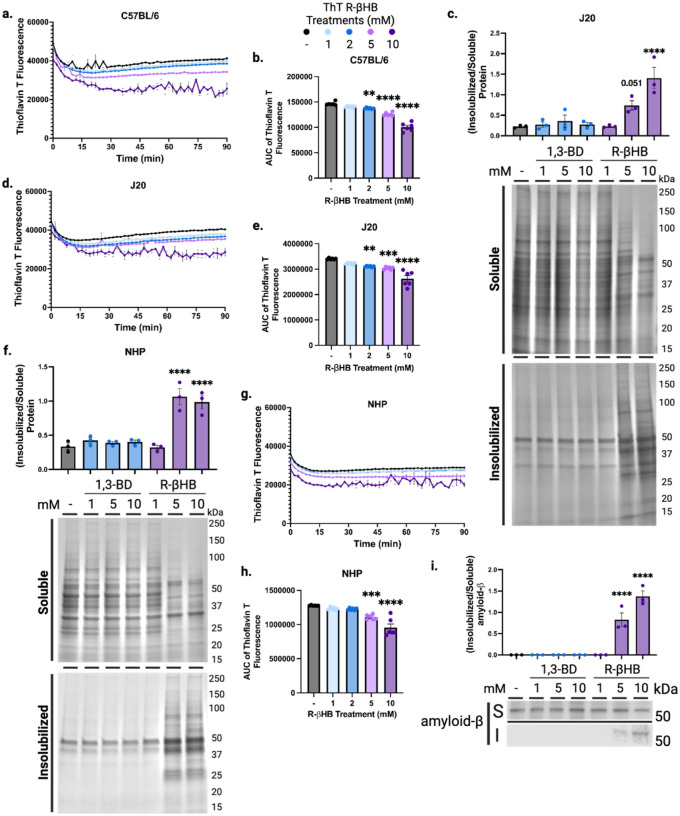
Fig. 3 |. β-hydroxybutyrate induces structural remodeling of proteins.
a-b, Total protein aggregation kinetics monitored via Thioflavin T fluorescence in mouse soluble cytosolic brain proteins treated with 1–10 mM of R-βHB from 24 month wild-type male, (a) timecourse and (b) area under the curve. c, Imperial stain of 4 month male J20 mouse soluble cytosolic brain proteins which remain soluble or are insolubilized after treatment with 1–10 mM of R-βHB and 1–10 mM of 1,3-BD. d-e, Total protein aggregation kinetics monitored via Thioflavin T fluorescence in mouse soluble cytosolic brain proteins treated with 1–10 mM of R-βHB from 4 month J20 male, (d) timecourse and (e) area under the curve. f, Imperial stain of 26 year male non-human primate soluble cytosolic brain proteins which remain soluble or are insolubilized after treatment with 1–10 mM of R-βHB and 1–10 mM of 1,3-BD. g-h, Total protein aggregation kinetics monitored via Thioflavin T fluorescence in non-human primate soluble cytosolic brain proteins treated with 1–10 mM of R-βHB from 26 year rhesus macaque male, (g) timecourse and (h) area under the curve. i, Western blot and quantification for amyloid-β (6E10) in soluble cytosolic J20 mouse brain proteins which remain soluble or are insolubilized after treatment with 1–10 mM of R-βHB and 1–10 mM of 1,3-BD.
a, Mean ± S.E.M, N=6, p-value calculated using two-way ANOVA with Dunnett’s multiple comparison test.
b, Mean ± S.E.M, N=6, p-value calculated using one-way ANOVA with Dunnett’s multiple comparison test.
c, Mean ± S.E.M, N=3, p-value calculated using one-way ANOVA with Dunnett’s multiple comparison test.
d, Mean ± S.E.M, N=6, p-value calculated using one-way ANOVA with Dunnett’s multiple comparison test.
e, Mean ± S.E.M, N=6, p-value calculated using one-way ANOVA with Dunnett’s multiple comparison test.
f, Mean ± S.E.M, N=3, p-value calculated using one-way ANOVA with Dunnett’s multiple comparison test.
g, Mean ± S.E.M, N=6, p-value calculated using one-way ANOVA with Dunnett’s multiple comparison test.
h, Mean ± S.E.M, N=6, p-value calculated using one-way ANOVA with Dunnett’s multiple comparison test.
i, Mean ± S.E.M, N=3, p-value calculated using one-way ANOVA with Dunnett’s multiple comparison test.

