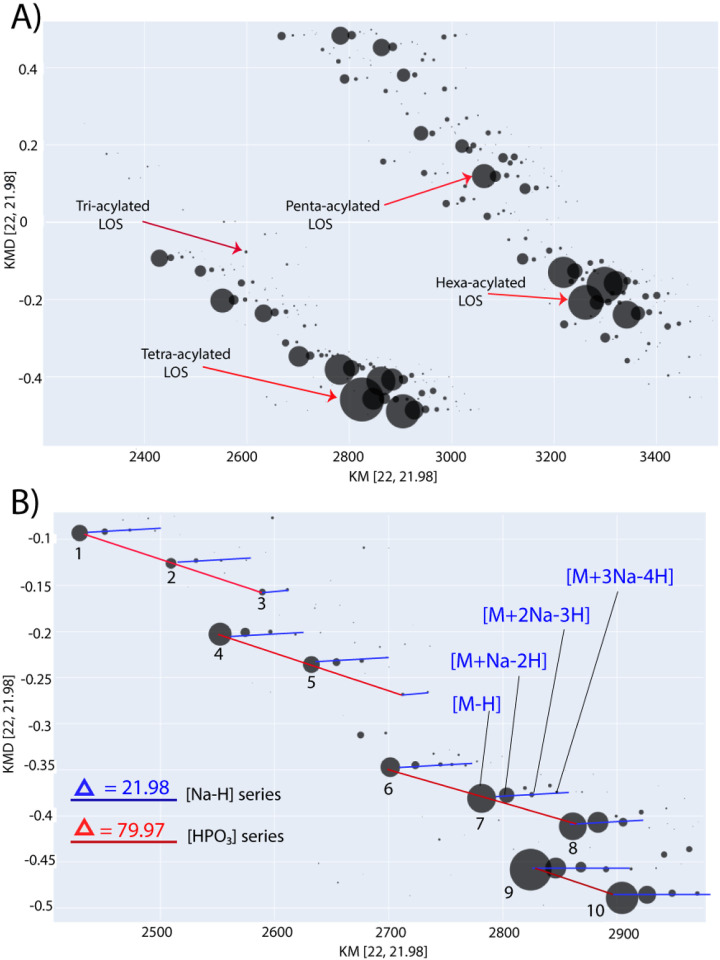
Figure 4:
KMD plot of the E. coli J5 (Rc mutant LOS) using [Na-H] base unit. a) Simplified KMD plot showing LOS families with different acylation degrees in the molecular weight range of 2200–3600 Da and their relative ion intensities. b) KMD plot region showing horizontal ion series (blue lines) differ by 21.98 Da [Na-H] while vertical ion series (red lines) differ by 79.97 [HPO3]. Ion clusters (1–5) have similar KMD arrangement/geometric pattern as ions cluster (6–10) demonstrating a constant structural difference of 272.03 Da corresponding to the combined incorporation of one phosphate and one heptose.

