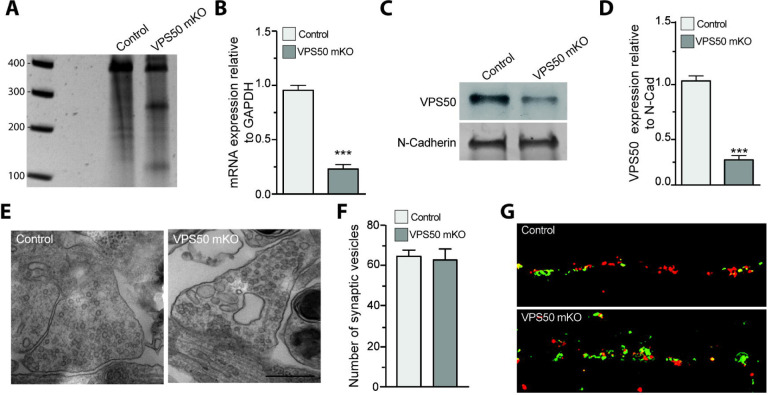
Figure 1. VPS50 gene edition causes decrease in synaptic vesicle acidification but no change in synaptic vesicle number.
(A) Surveyor assay of Control or VPS50 mKO cortical neurons. (B) RT-qPCR to quantify relative mRNA expression of VPS50 mKO. (C-D) VPS50 protein expression in VPS50 mKO and Control neurons. (E-F) Representative images of synaptic terminals by electron microscopy and quantification of the number of synaptic vesicles in Control and VPS50 mKO neurons (n=50 cells per condition). (G) Representative images of Ratio-SyPhy signal to determine synaptic vesicle acidification in Control and VPS50 mKO neurons. Scale bar, 25um. ***p<0.001.

