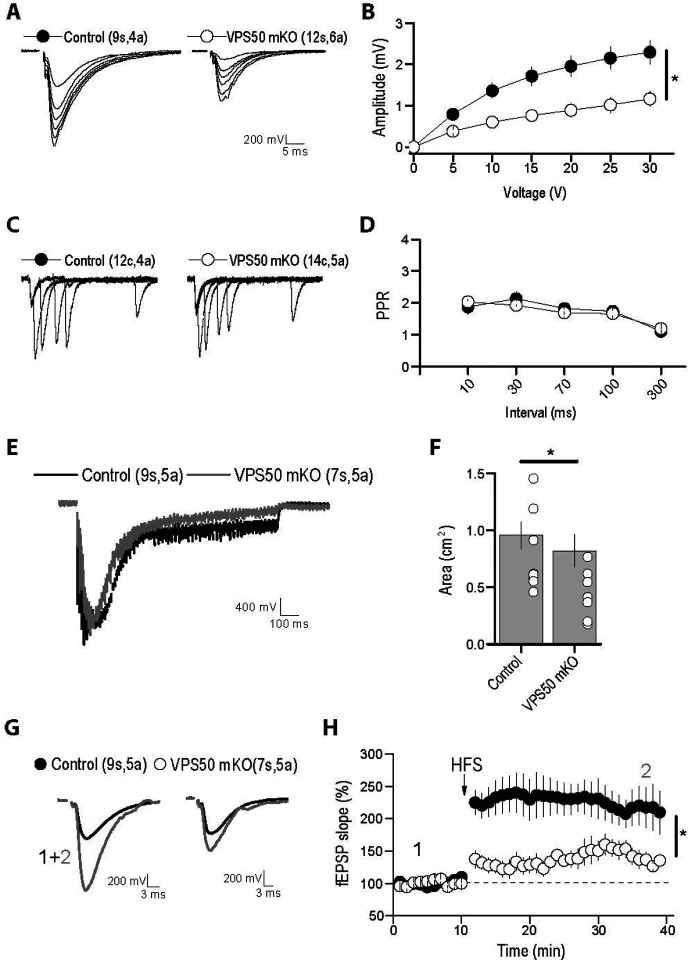
Figure 6. Hippocampal synaptic function and plasticity are impaired in VSP50 mKO mice.
Electrophysiological recording of Control and VPS50 mKO hippocampal slices. (A) Representative traces of Input-output responses. (B) Input-output curves reveal a strong reduction in the amplitude of evoked EPSC at all stimulus intensity tested. (C) Representative traces and (D) quantification of paired-pulse facilitation at different interstimulus interval. (E) Representative traces and quantification (F) of the response to high-frequency stimulation. (G) Representative traces before and after LTP induction by highfrequency stimulation. (H) Quantification of potentials during LTP induction. Number of slices (s) or cells (c) and animals (a) are indicated in parenthesis. * p<0.05.

